Carlyle Investor Conference Presentation Deck
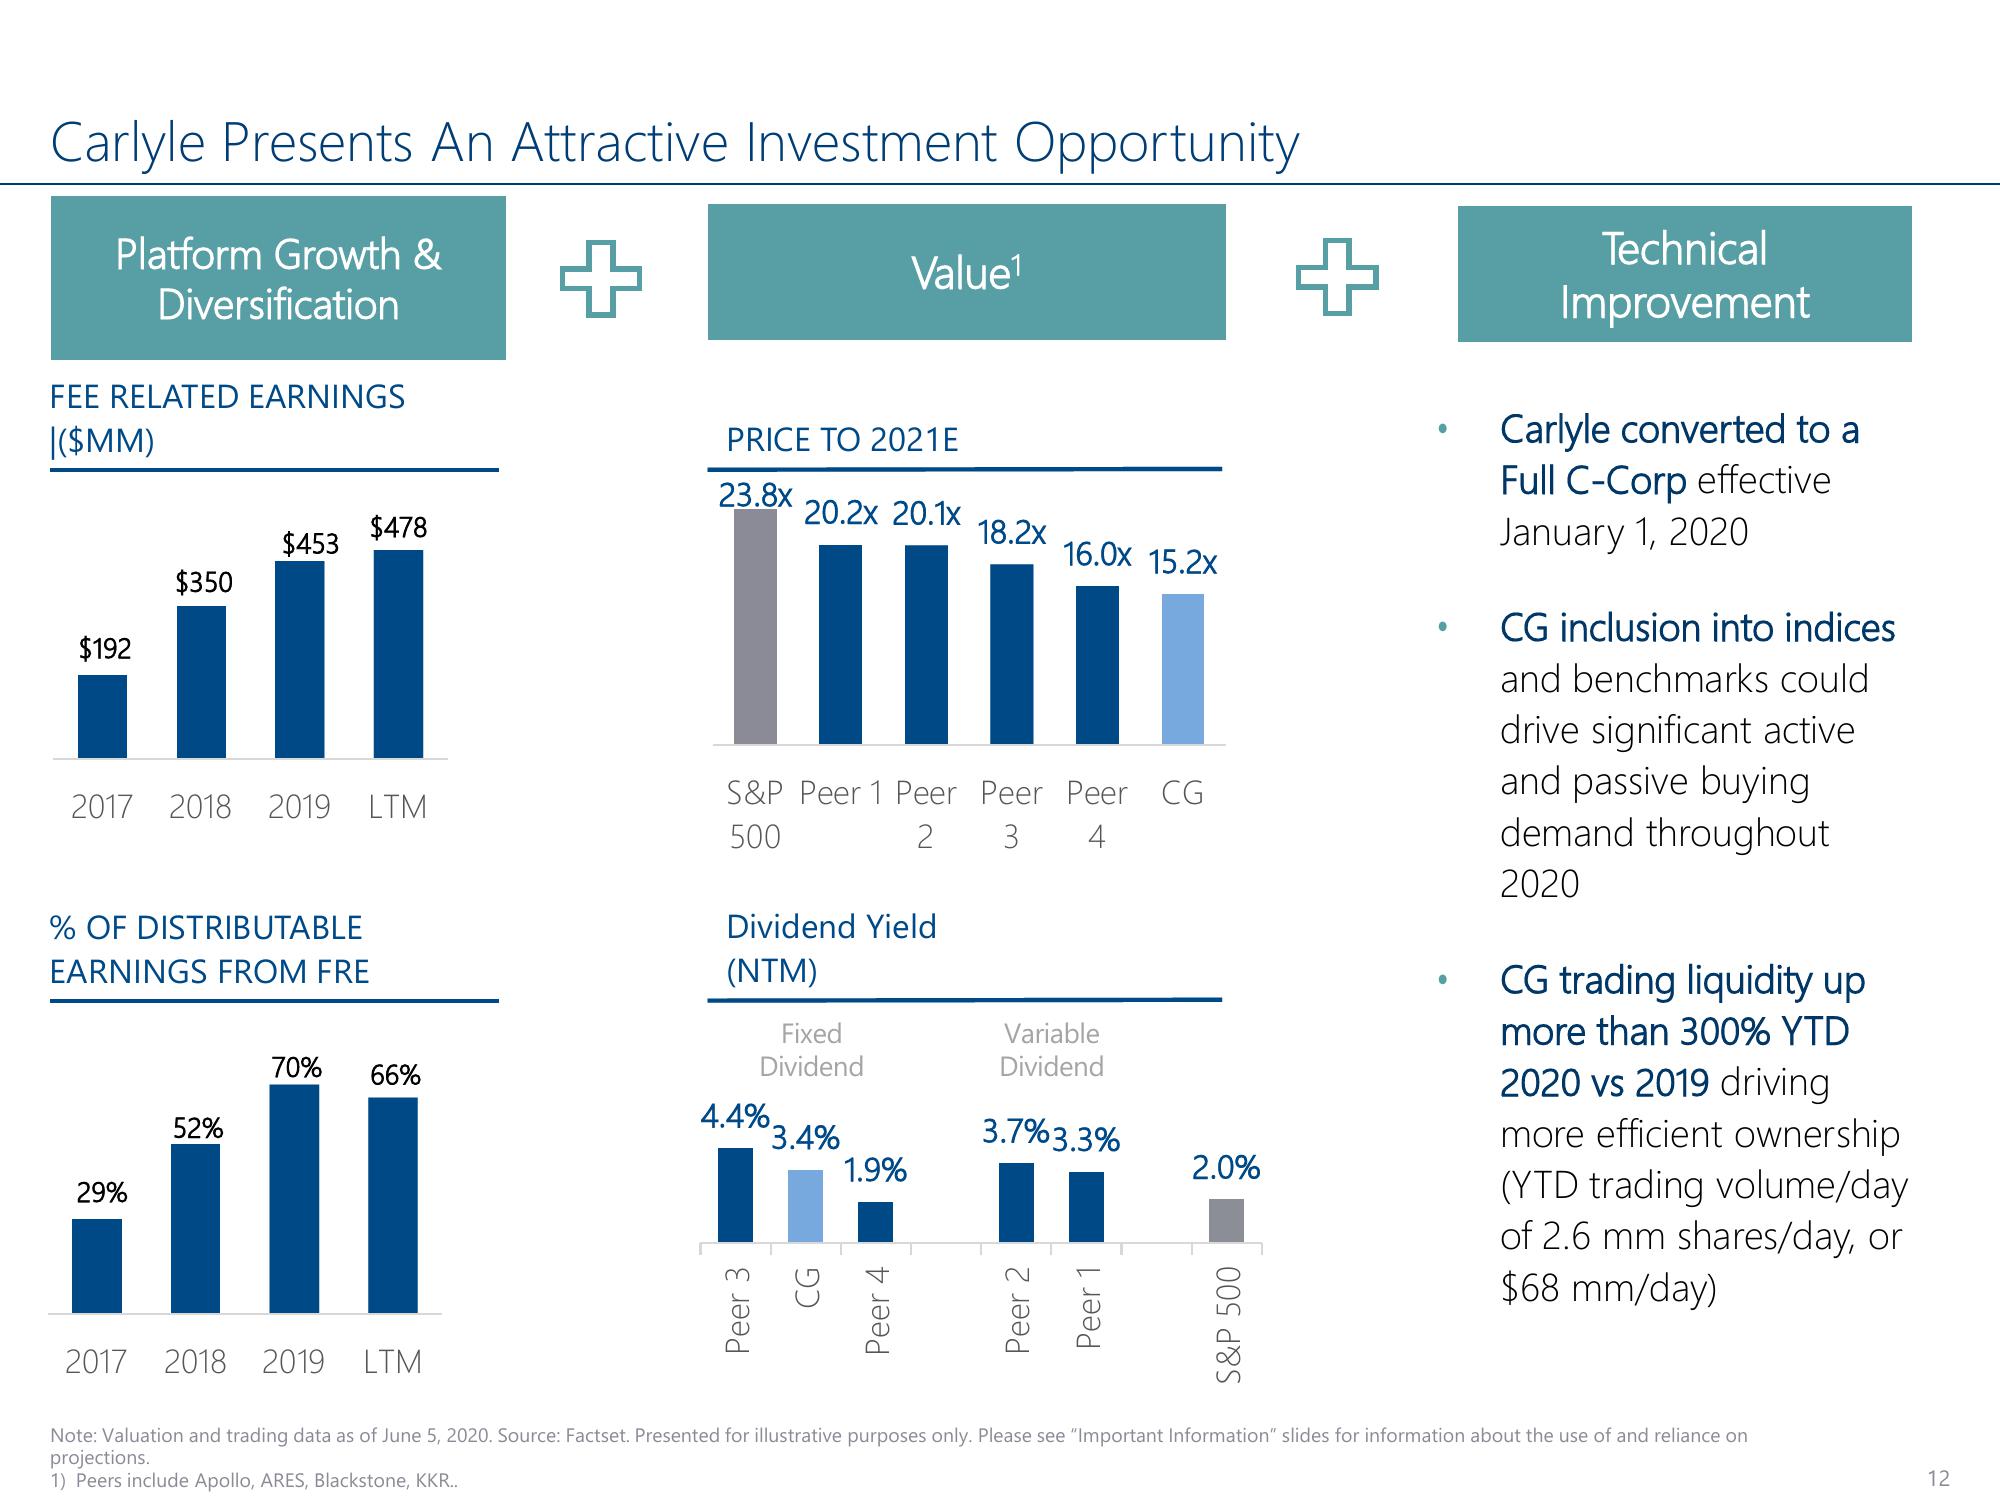
Carlyle Presents An Attractive Investment Opportunity
Platform Growth &
Diversification
FEE RELATED EARNINGS
|($MM)
$192
$350
29%
$453
2017 2018 2019 LTM
$478
% OF DISTRIBUTABLE
EARNINGS FROM FRE
52%
70% 66%
2017 2018 2019 LTM
PRICE TO 2021E
23.8x
20.2x 20.1x
S&P Peer 1 Peer
500
2
Dividend Yield
(NTM)
Fixed
Dividend
4.4%.
Value¹
3.4%
1.9%
CG
Peer 3
Peer 4
18.2x
16.0x 15.2x
11
Peer
3 4
Peer CG
Variable
Dividend
3.7%3.3%
Peer 2
Peer 1
2.0%
S&P 500
+
●
●
●
Technical
Improvement
Carlyle converted to a
Full C-Corp effective
January 1, 2020
CG inclusion into indices
and benchmarks could
drive significant active
and passive buying
demand throughout
2020
CG trading liquidity up
more than 300% YTD
2020 vs 2019 driving
more efficient ownership
(YTD trading volume/day
of 2.6 mm shares/day, or
$68 mm/day)
Note: Valuation and trading data as of June 5, 2020. Source: Factset. Presented for illustrative purposes only. Please see "Important Information" slides for information about the use of and reliance on
projections.
1) Peers include Apollo, ARES, Blackstone, KKR..
12View entire presentation