PJT Partners Investment Banking Pitch Book
Asset Overview (Cont'd)
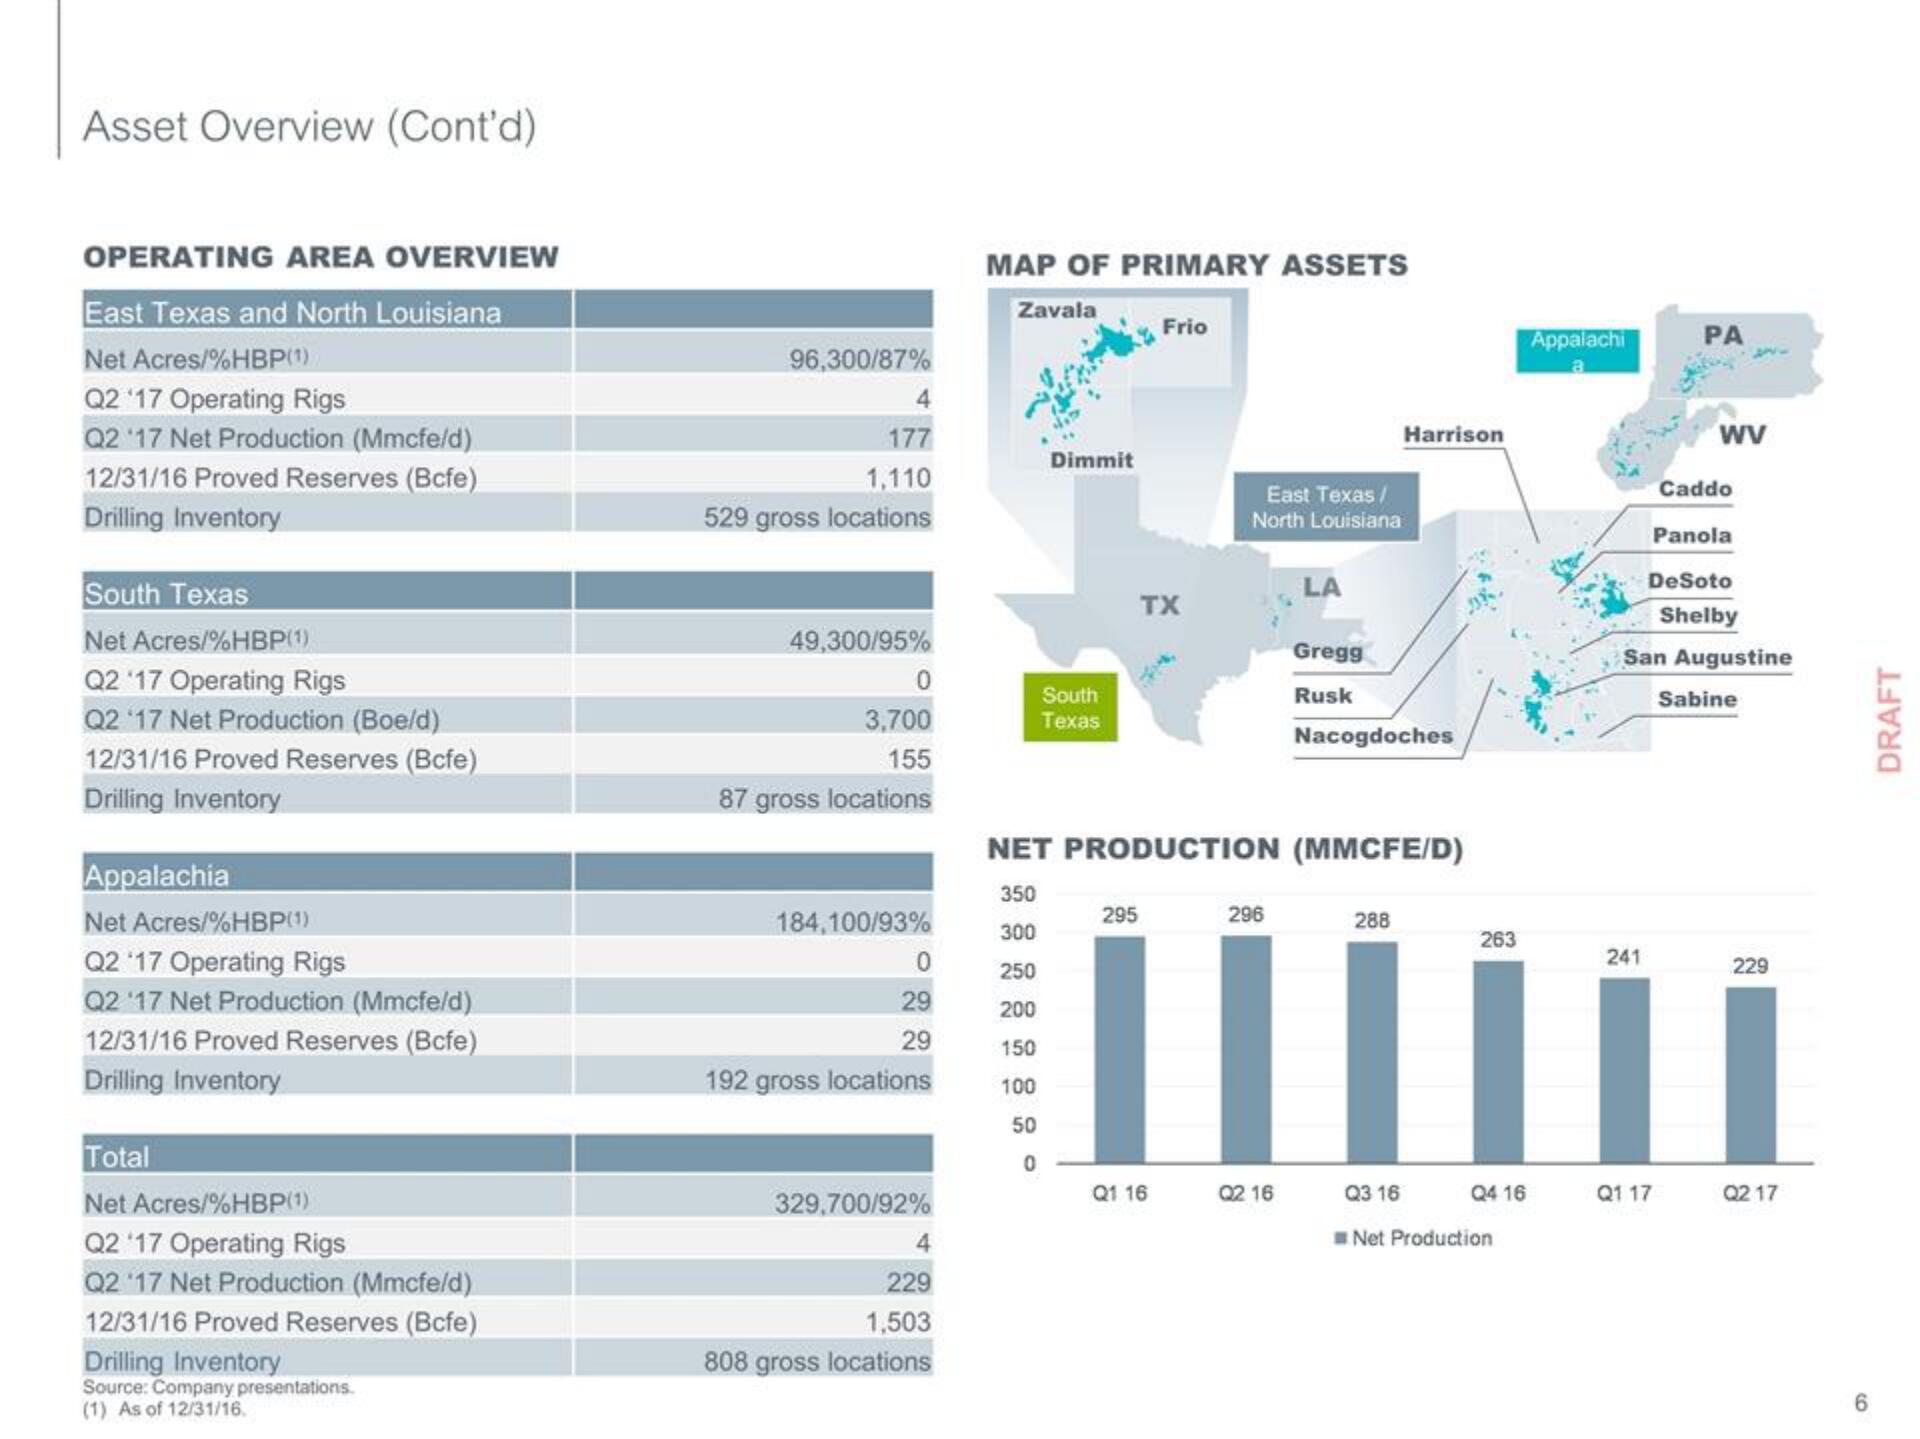
OPERATING AREA OVERVIEW
East Texas and North Louisiana
Net Acres/%HBP(1)
Q2 '17 Operating Rigs
Q2 '17 Net Production (Mmcfe/d)
12/31/16 Proved Reserves (Bcfe)
Drilling Inventory
South Texas
Net Acres/%HBP(1)
Q2 '17 Operating Rigs
Q2 '17 Net Production (Boe/d)
12/31/16 Proved Reserves (Bcfe)
Drilling Inventory
Appalachia
Net Acres/%HBP(¹)
Q2 '17 Operating Rigs
Q2 '17 Net Production (Mmcfe/d)
12/31/16 Proved Reserves (Bcfe)
Drilling Inventory
Total
Net Acres/%HBP(1)
Q2 '17 Operating Rigs
Q2 '17 Net Production (Mmcfe/d)
12/31/16 Proved Reserves (Bcfe)
Drilling Inventory
Source: Company presentations.
(1) As of 12/31/16.
96,300/87%
177
1,110
529 gross locations
49,300/95%
0
3,700
155
87 gross locations
184,100/93%
0
29
29
192 gross locations
329,700/92%
229
1,503
808 gross locations
MAP OF PRIMARY ASSETS
Zavala
Frio
Dimmit
South
Texas
TX
295
East Texas /
North Louisiana
Q1 16
296
LA
NET PRODUCTION (MMCFE/D)
350
300
250
200
150
100
50
0
Q2 16
Gregg
Rusk
Harrison
Nacogdoches
288
263
Q3 16
Net Production
Q4 16
Appalachi
241
PA
Q1 17
WV
Panola
DeSoto
Shelby
San Augustine
Sabine
Caddo
229
Q217
6
DRAFTView entire presentation