Adtheorent SPAC Presentation Deck
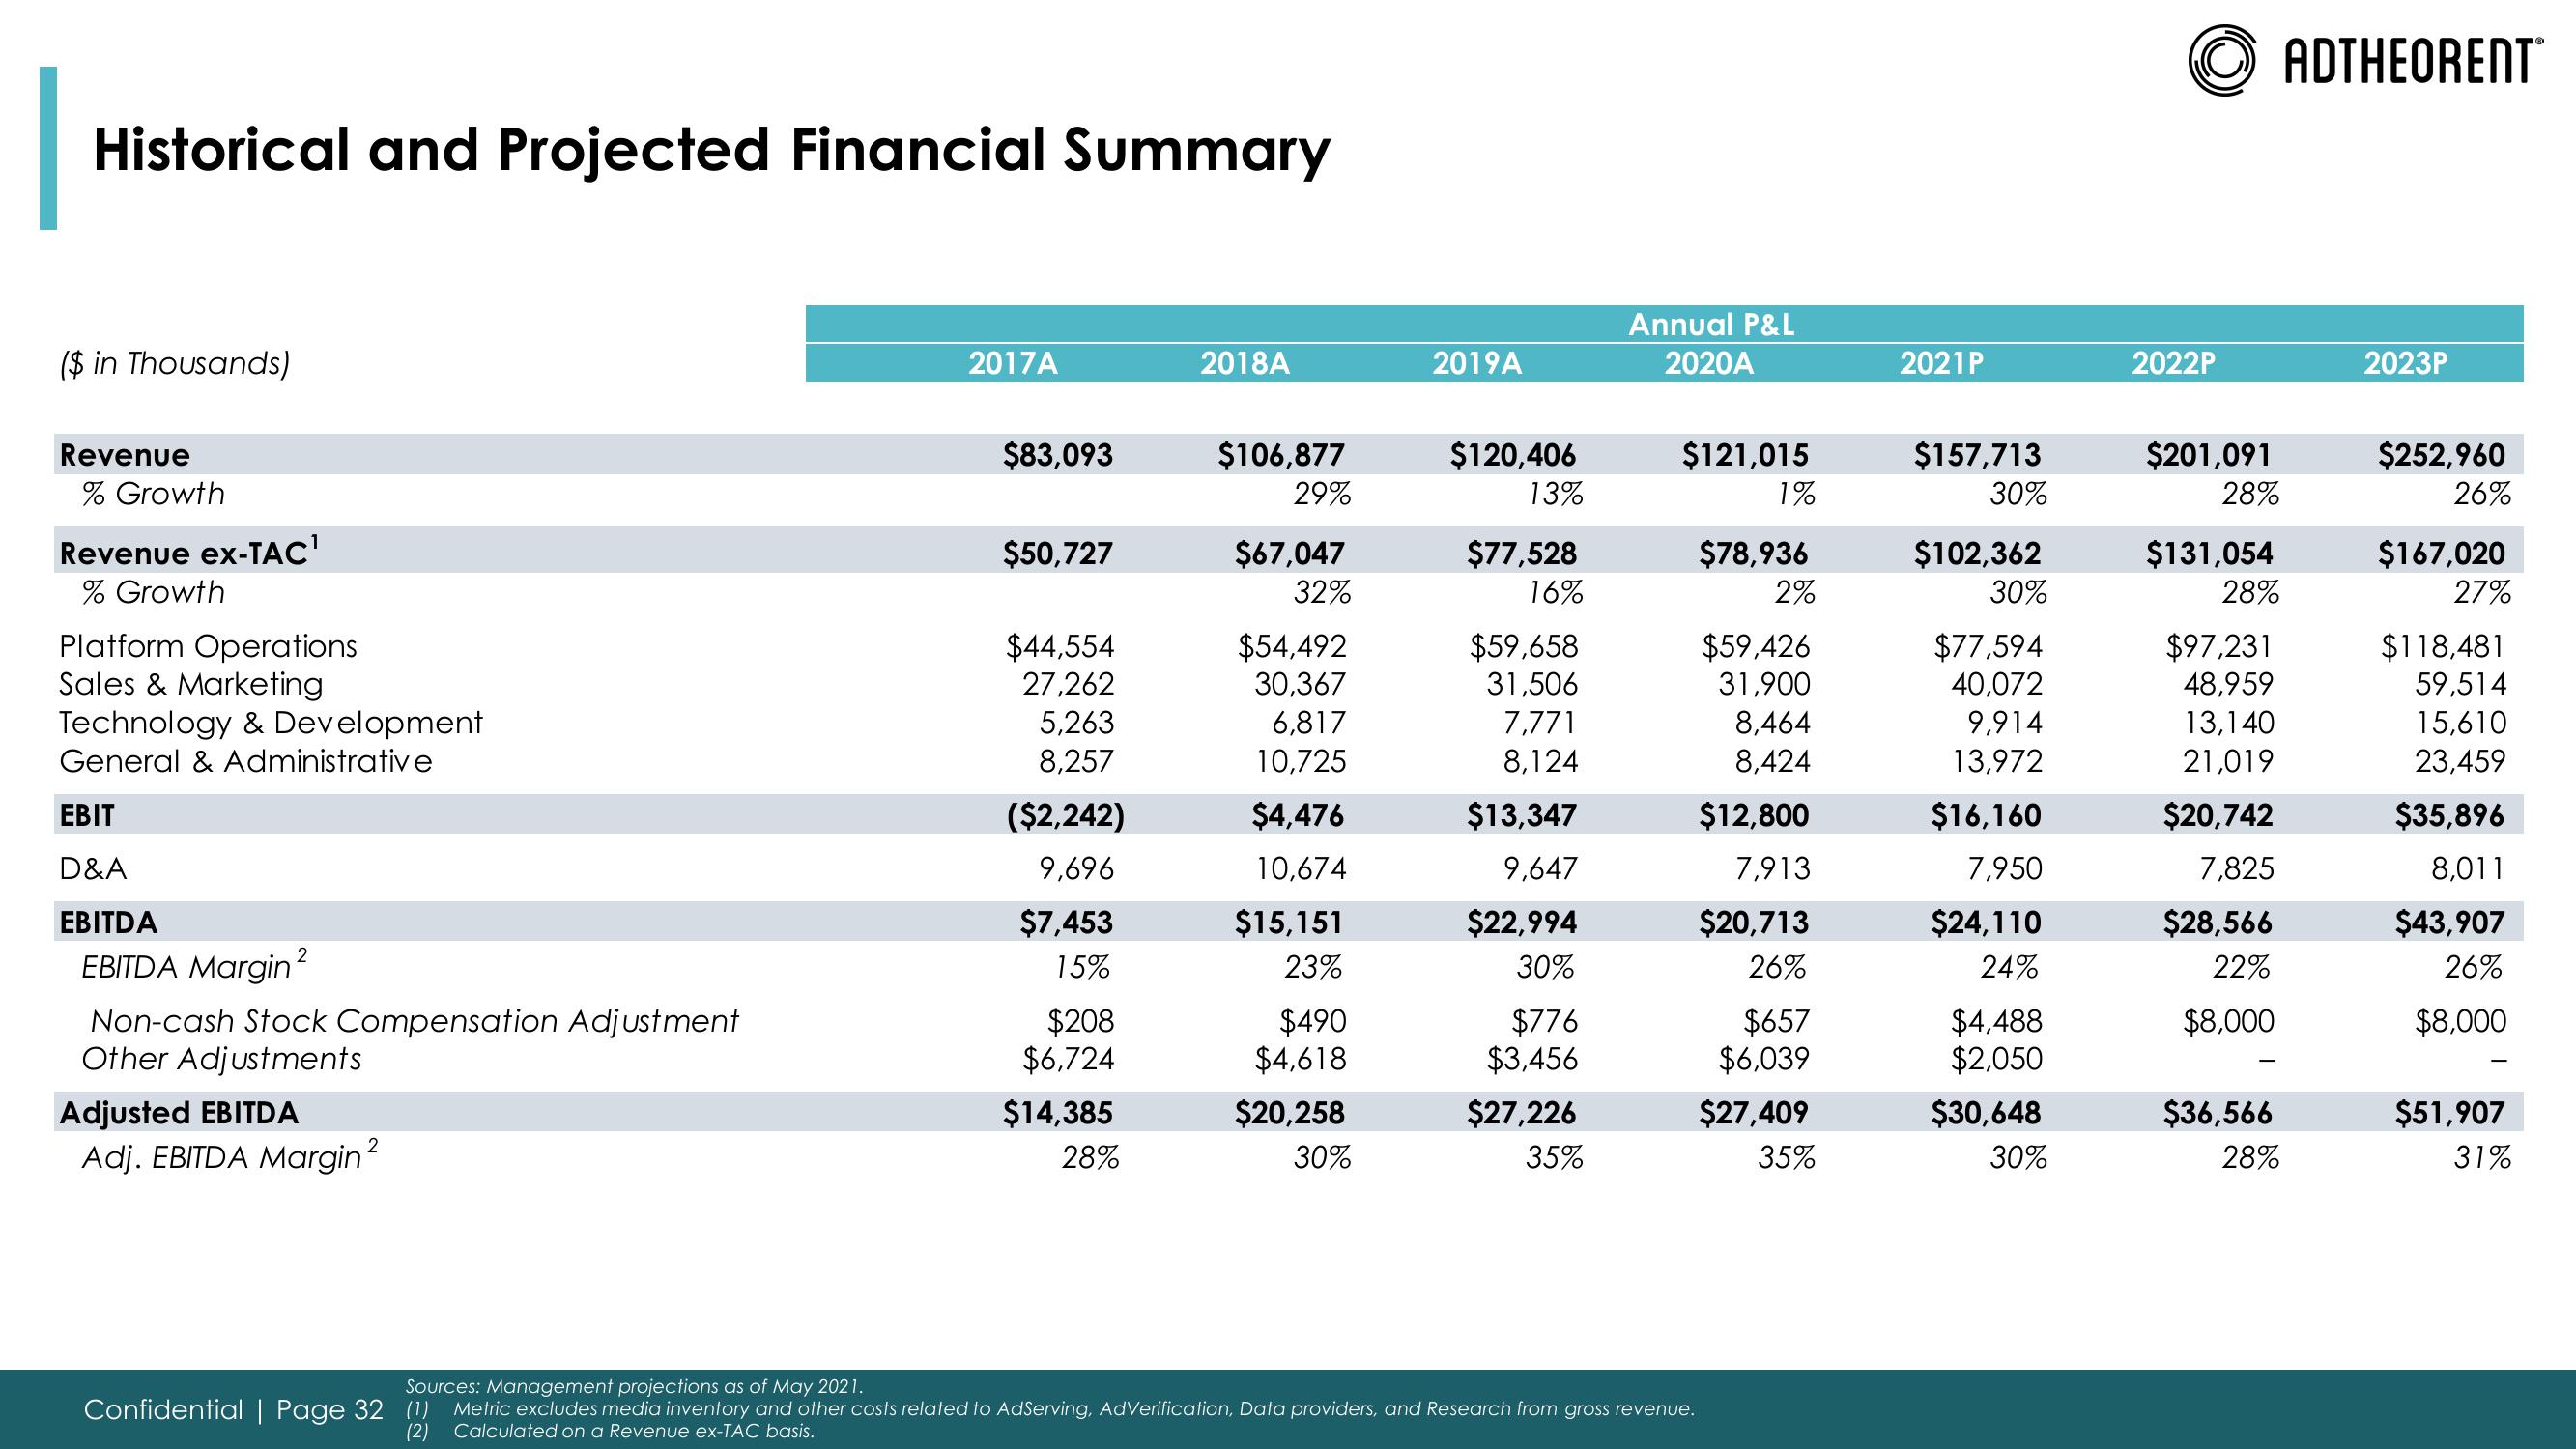
Historical and Projected Financial Summary
($ in Thousands)
Revenue
% Growth
Revenue ex-TAC¹
% Growth
Platform Operations
Sales & Marketing
Technology & Development
General & Administrative
EBIT
D&A
EBITDA
2
EBITDA Margin ²
Non-cash Stock Compensation Adjustment
Other Adjustments
Adjusted EBITDA
Adj. EBITDA Margin²
2017A
$83,093
$50,727
$44,554
27,262
5,263
8,257
($2,242)
9,696
$7,453
15%
$208
$6,724
$14,385
28%
2018A
$106,877
29%
$67,047
32%
$54,492
30,367
6,817
10,725
$4,476
10,674
$15,151
23%
$490
$4,618
$20,258
30%
2019A
$120,406
13%
$77,528
16%
$59,658
31,506
7,771
8,124
$13,347
9,647
$22,994
30%
$776
$3,456
$27,226
35%
Annual P&L
2020A
$121,015
1%
Sources: Management projections as of May 2021.
Confidential | Page 32 (1) Metric excludes media inventory and other costs related to AdServing, AdVerification, Data providers, and Research from gross revenue.
(2) Calculated on a Revenue ex-TAC basis.
$78,936
2%
$59,426
31,900
8,464
8,424
$12,800
7,913
$20,713
26%
$657
$6,039
$27,409
35%
2021P
$157,713
30%
$102,362
30%
$77,594
40,072
9,914
13,972
$16,160
7,950
$24,110
24%
$4,488
$2,050
$30,648
30%
2022P
$201,091
28%
$131,054
28%
$97,231
48,959
13,140
21,019
$20,742
7,825
$28,566
22%
$8,000
$36,566
28%
ADTHEORENT
2023P
$252,960
26%
$167,020
27%
$118,481
59,514
15,610
23,459
$35,896
8,011
$43,907
26%
$8,000
$51,907
31%View entire presentation