J.P.Morgan Investment Banking Pitch Book
VALUATION SUMMARY
Discounted cash flow analysis
Assumptions
■ EBITDA margin improvement of 0.25% assumed in each
year after 2010 until 2015
■ No synergies
$76mm Reethi Rah notes receivable monetized in 2008
Ten year projection period
■ 3% revenue growth assumed each year after 2010 until
2015
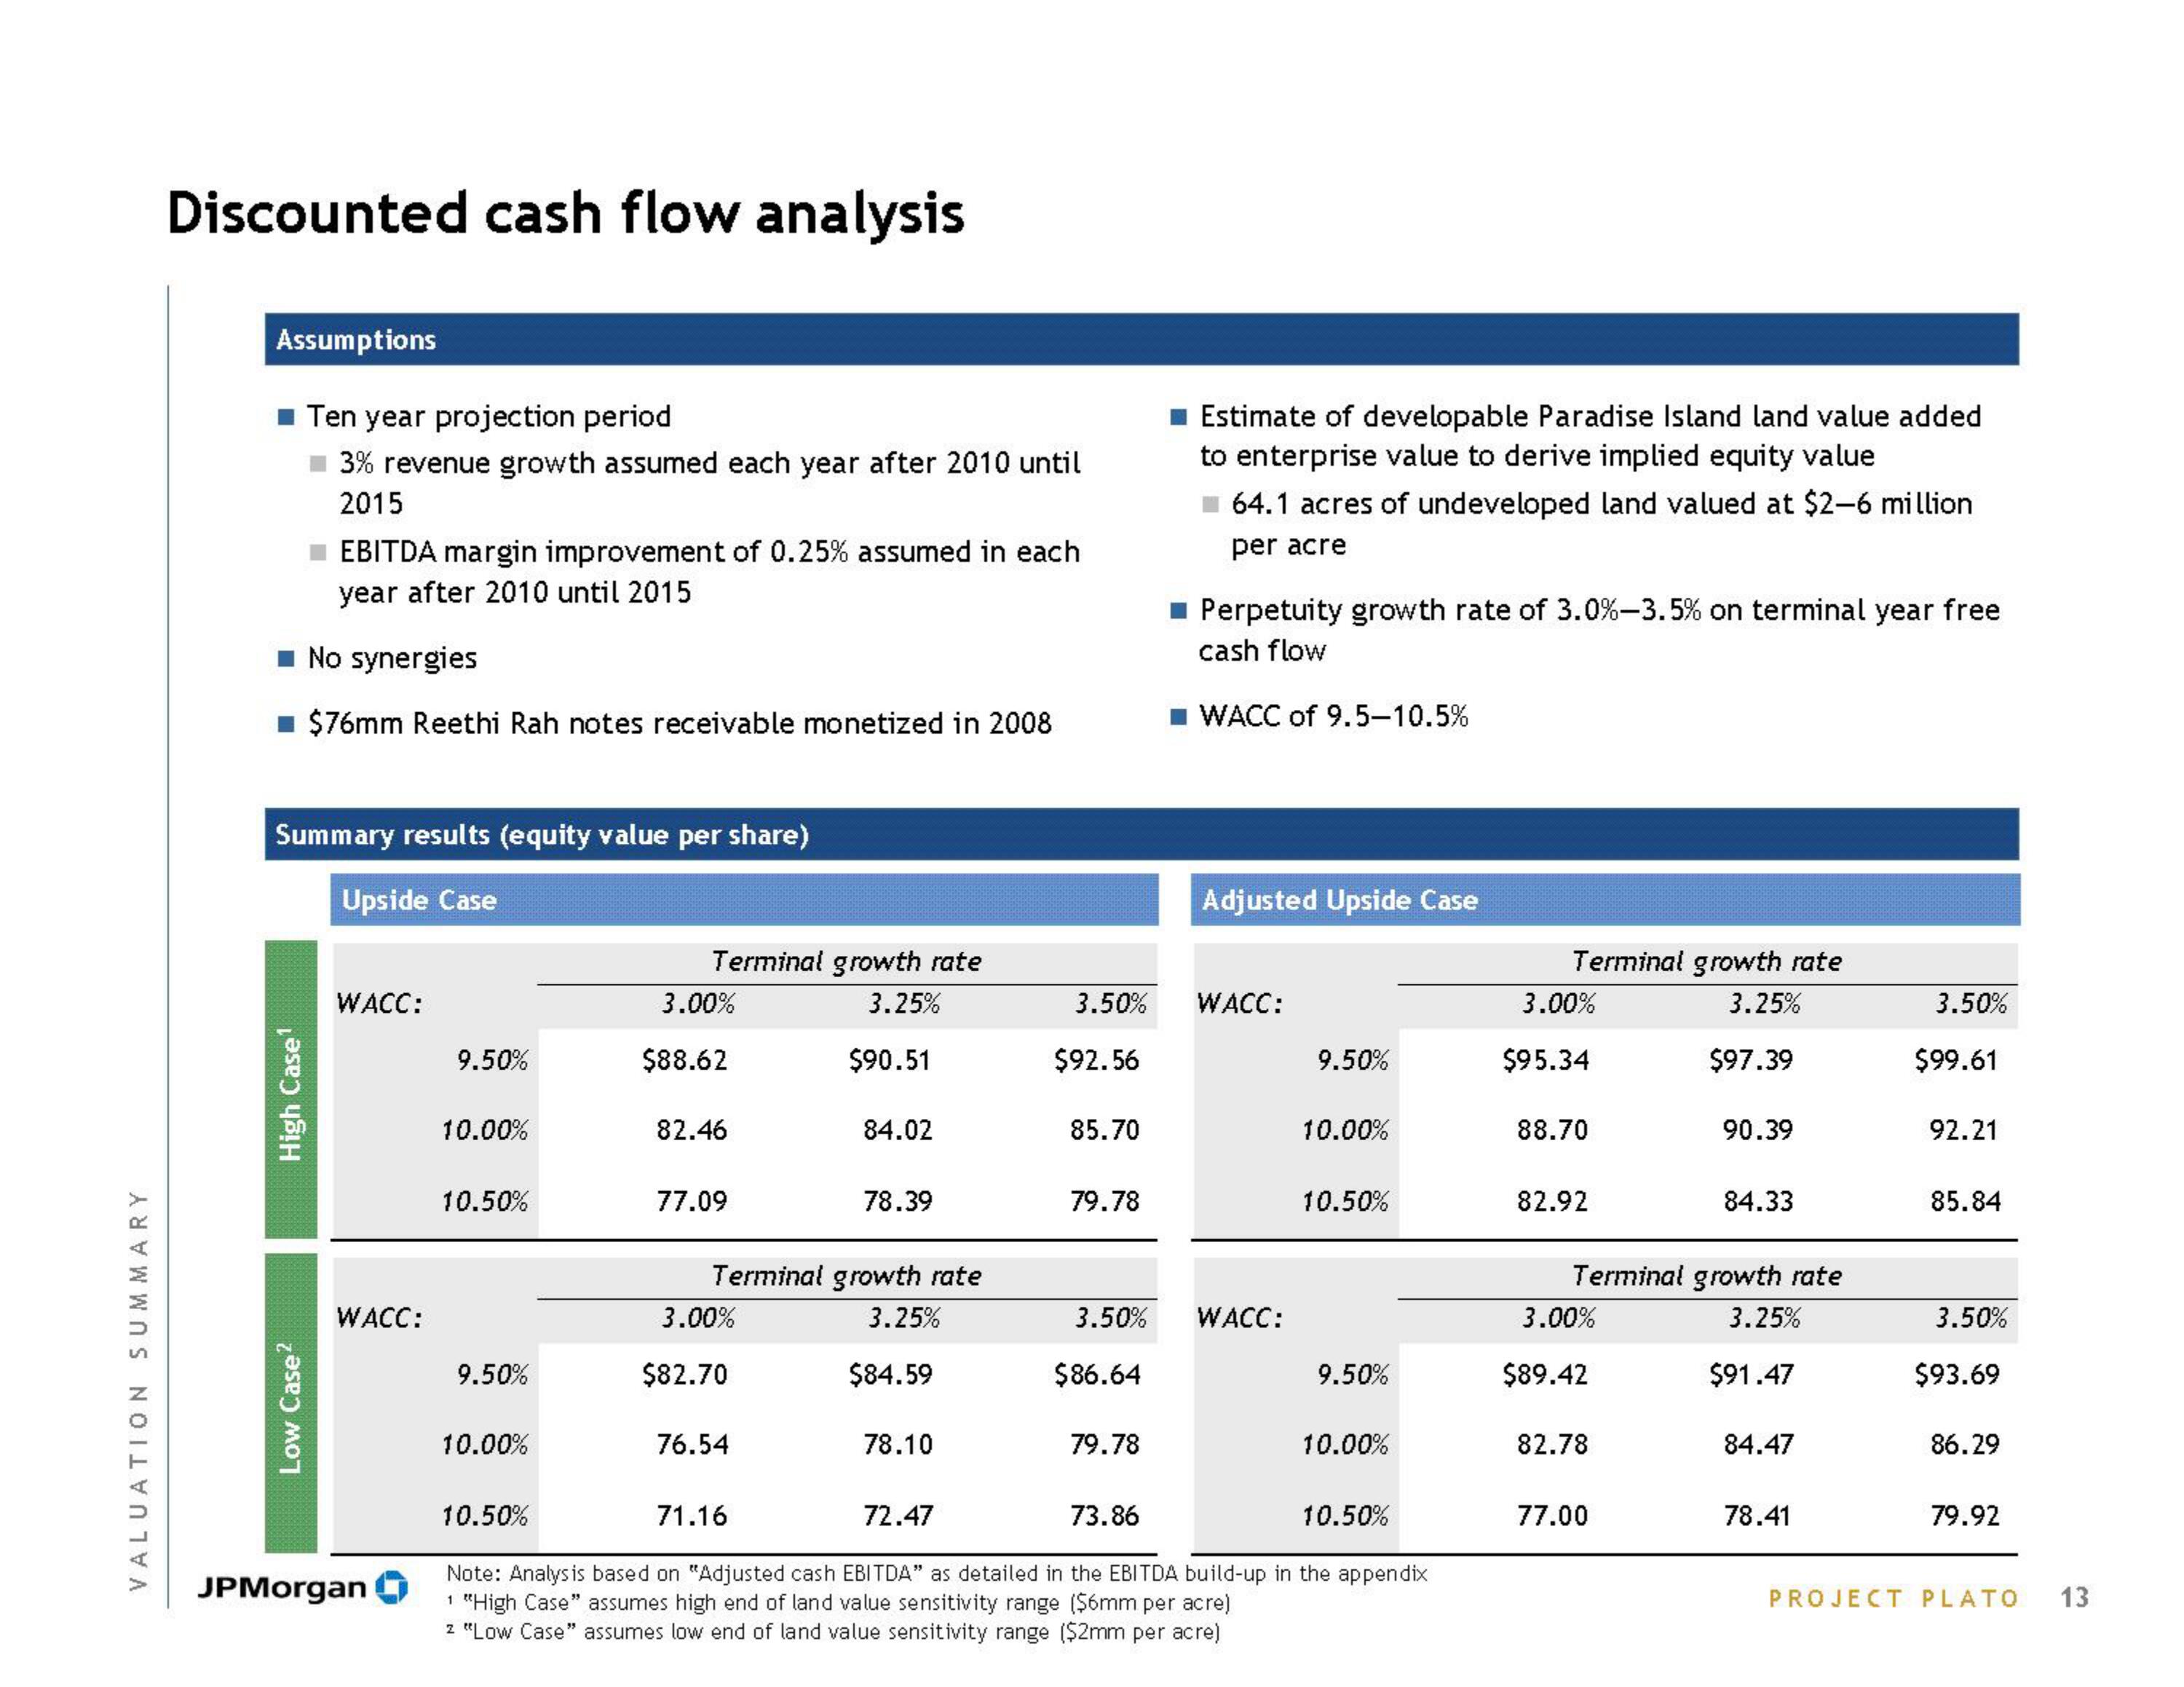
Summary results (equity value per share)
Upside Case
High Case¹
Low Case²
WACC:
WACC:
JPMorgan
9.50%
10.00%
10.50%
9.50%
10.00%
Terminal growth rate
3.25%
3.00%
$88.62
82.46
77.09
3.00%
$82.70
Terminal growth rate
3.25%
$84.59
76.54
$90.51
84.02
71.16
78.39
78.10
3.50%
72.47
$92.56
85.70
79.78
■ Estimate of developable Paradise Island land value added
to enterprise value to derive implied equity value
64.1 acres of undeveloped land valued at $2-6 million
per acre
79.78
■ Perpetuity growth rate of 3.0%-3.5% on terminal year free
cash flow
■WACC of 9.5-10.5%
Adjusted Upside Case
WACC:
3.50% WACC:
$86.64
9.50%
10.00%
10.50%
9.50%
10.50%
73.86
Note: Analysis based on "Adjusted cash EBITDA" as detailed in the EBITDA build-up in the appendix
1 "High Case" assumes high end of land value sensitivity range ($6mm per acre)
z "Low Case" assumes low end of land value sensitivity range ($2mm per acre)
10.00%
10.50%
Terminal growth rate
3.25%
$97.39
3.00%
$95.34
88.70
82.92
3.00%
$89.42
Terminal growth rate
3.25%
$91.47
82.78
90.39
77.00
84.33
84.47
78.41
3.50%
$99.61
92.21
85.84
3.50%
$93.69
86.29
79.92
PROJECT PLATO 13View entire presentation