Apollo Global Management Mergers and Acquisitions Presentation Deck
Case Study: Athene Comparison to Global Atlantic (cont'd)
Financial Strength Ratings & Operating Metrics ¹ 2
Profitability 23
Athene
A/A/A
~ 1,300
Employees
25bps
OpEx / Avg. Assets
12.7%
Global Atlantic
Athene
A/A-/A
~1,100
Employees
52bps
OpEx / Avg. Assets
Financial Leverage²
Adjusted Debt to Capital
20.5%
Adj. Operating ROE
Global Atlantic
17%
Athene
Global Atlantic
15%
13.0x
Adj. Operating ROA
Athene
0.93%
Athene
Asset Leverage²
Average Adj. Invested Assets / Adj. Equity
0.77%
19.1x
Global Atlantic
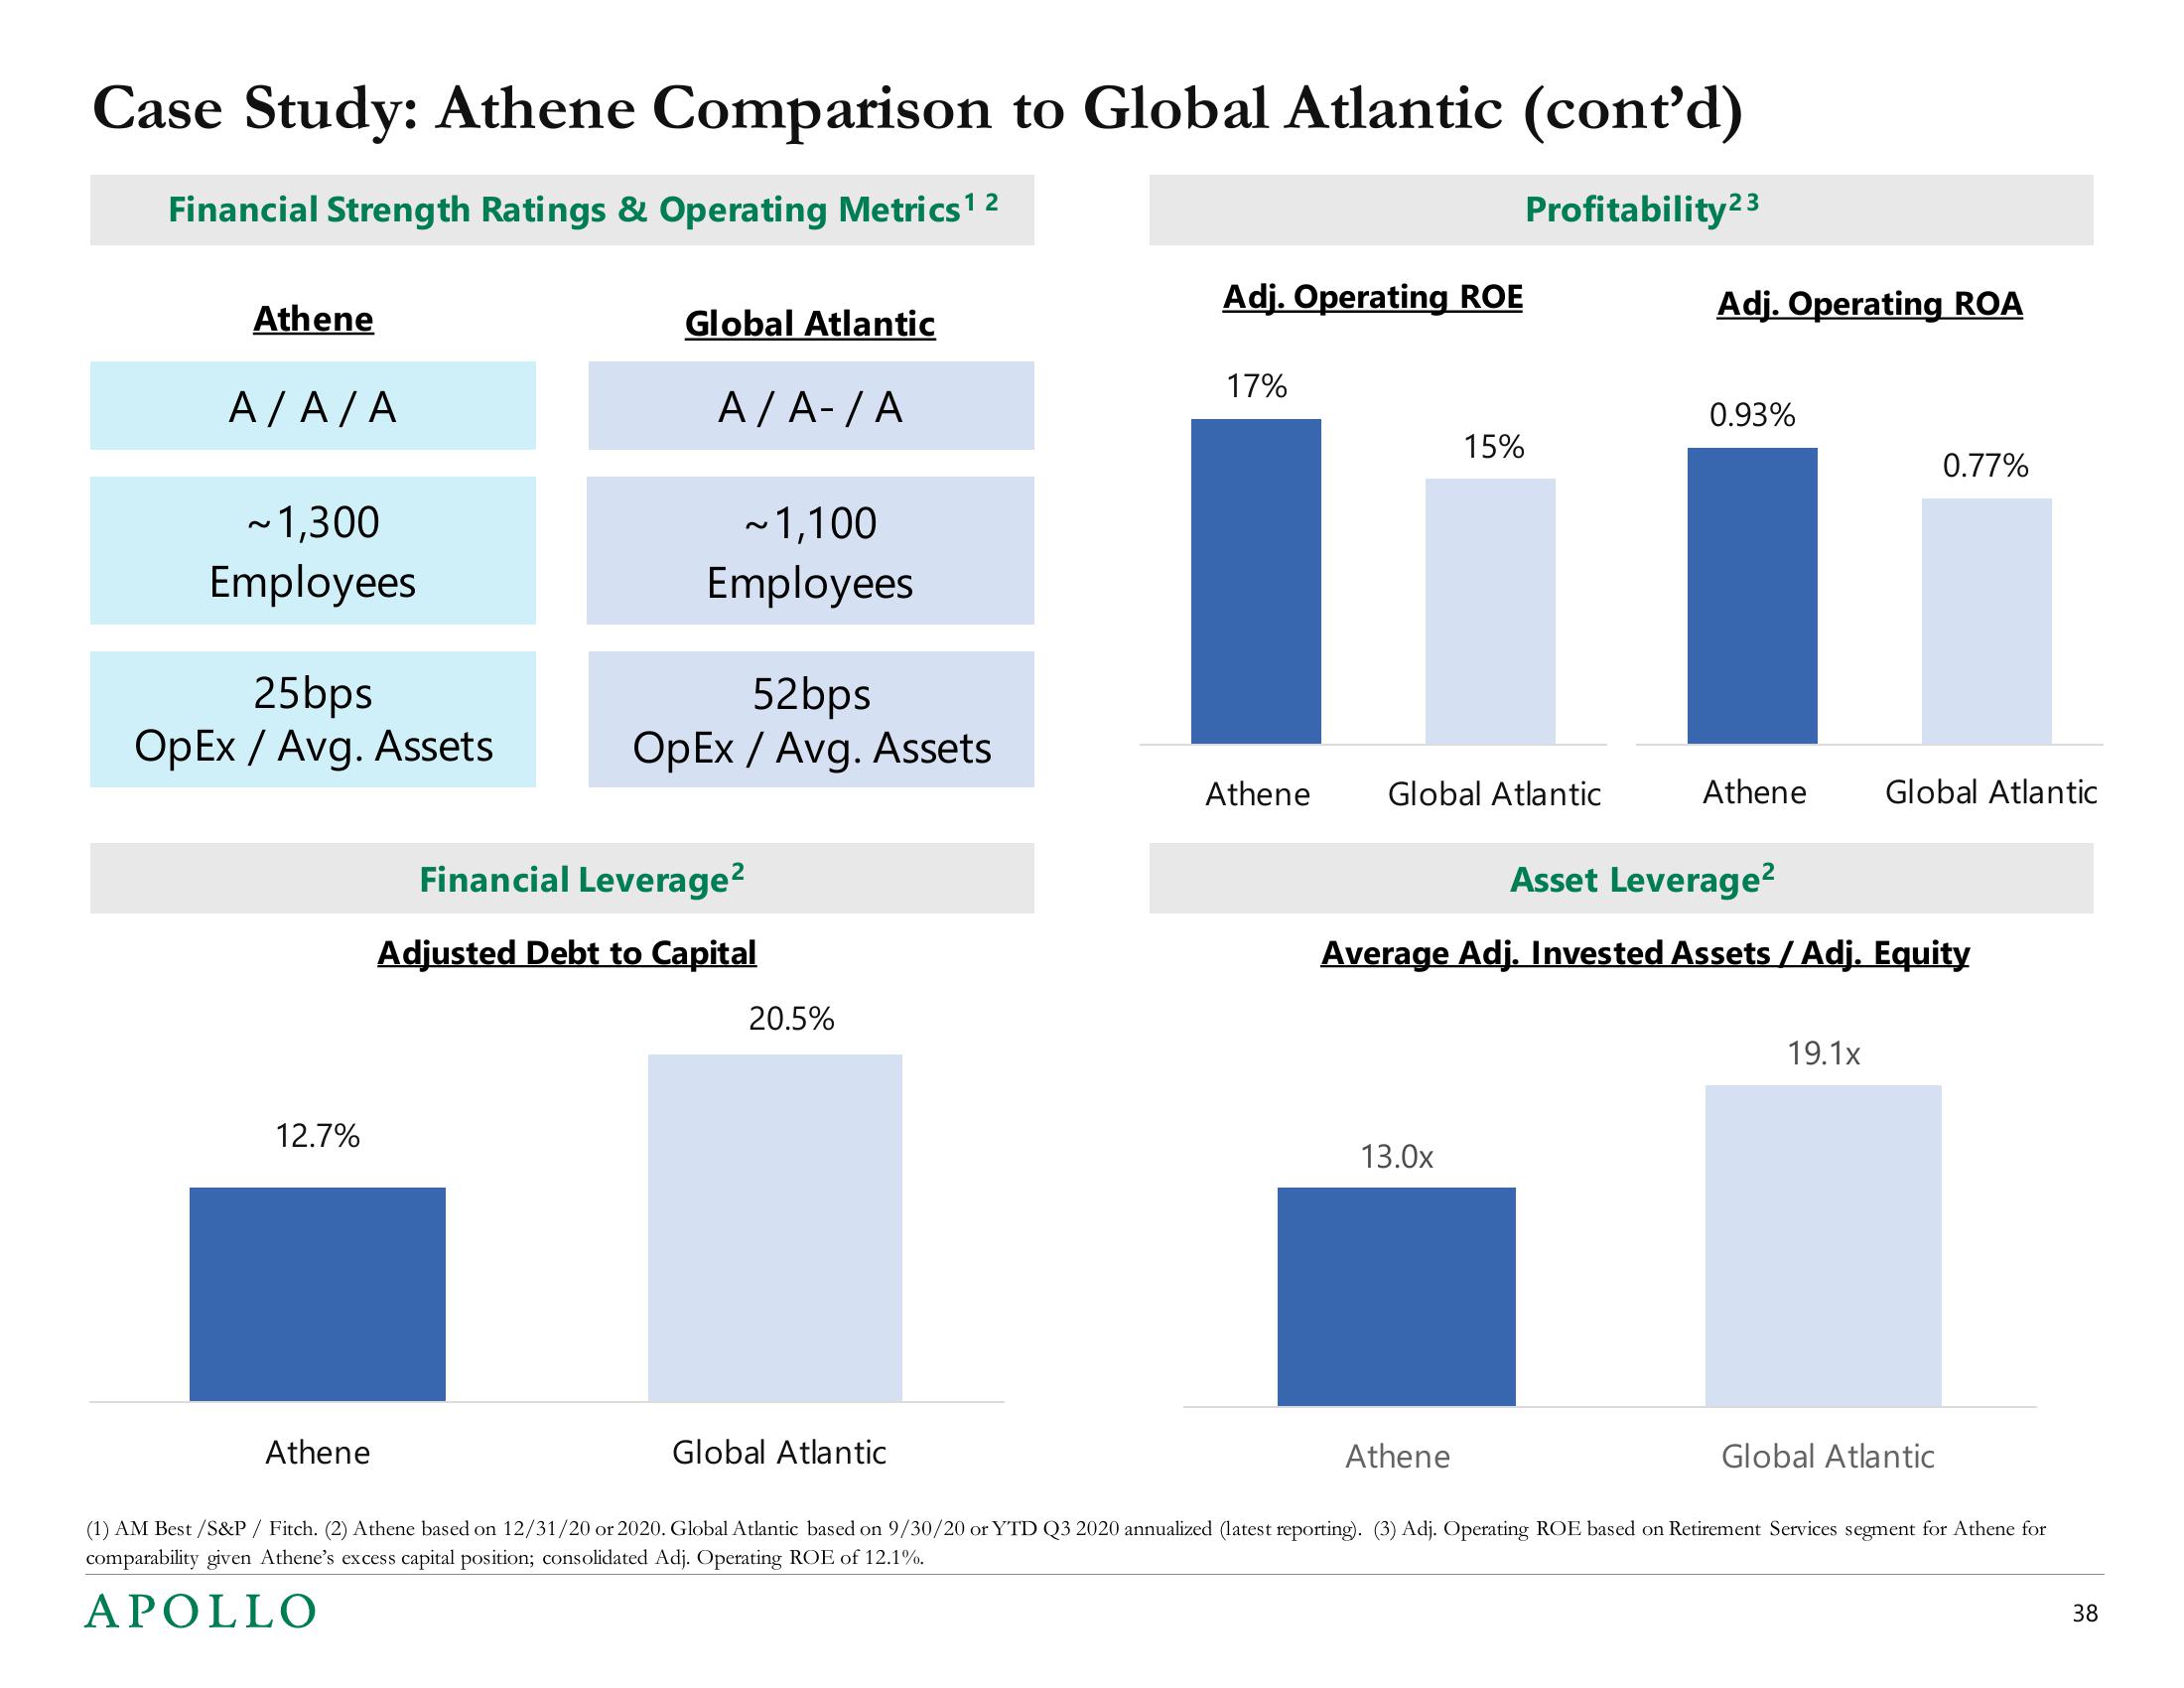
(1) AM Best /S&P / Fitch. (2) Athene based on 12/31/20 or 2020. Global Atlantic based on 9/30/20 or YTD Q3 2020 annualized (latest reporting). (3) Adj. Operating ROE based on Retirement Services segment for Athene for
comparability given Athene's excess capital position; consolidated Adj. Operating ROE of 12.1%.
APOLLO
Global Atlantic
38View entire presentation