Maersk Investor Presentation Deck
Financial highlights
Consolidated financial information
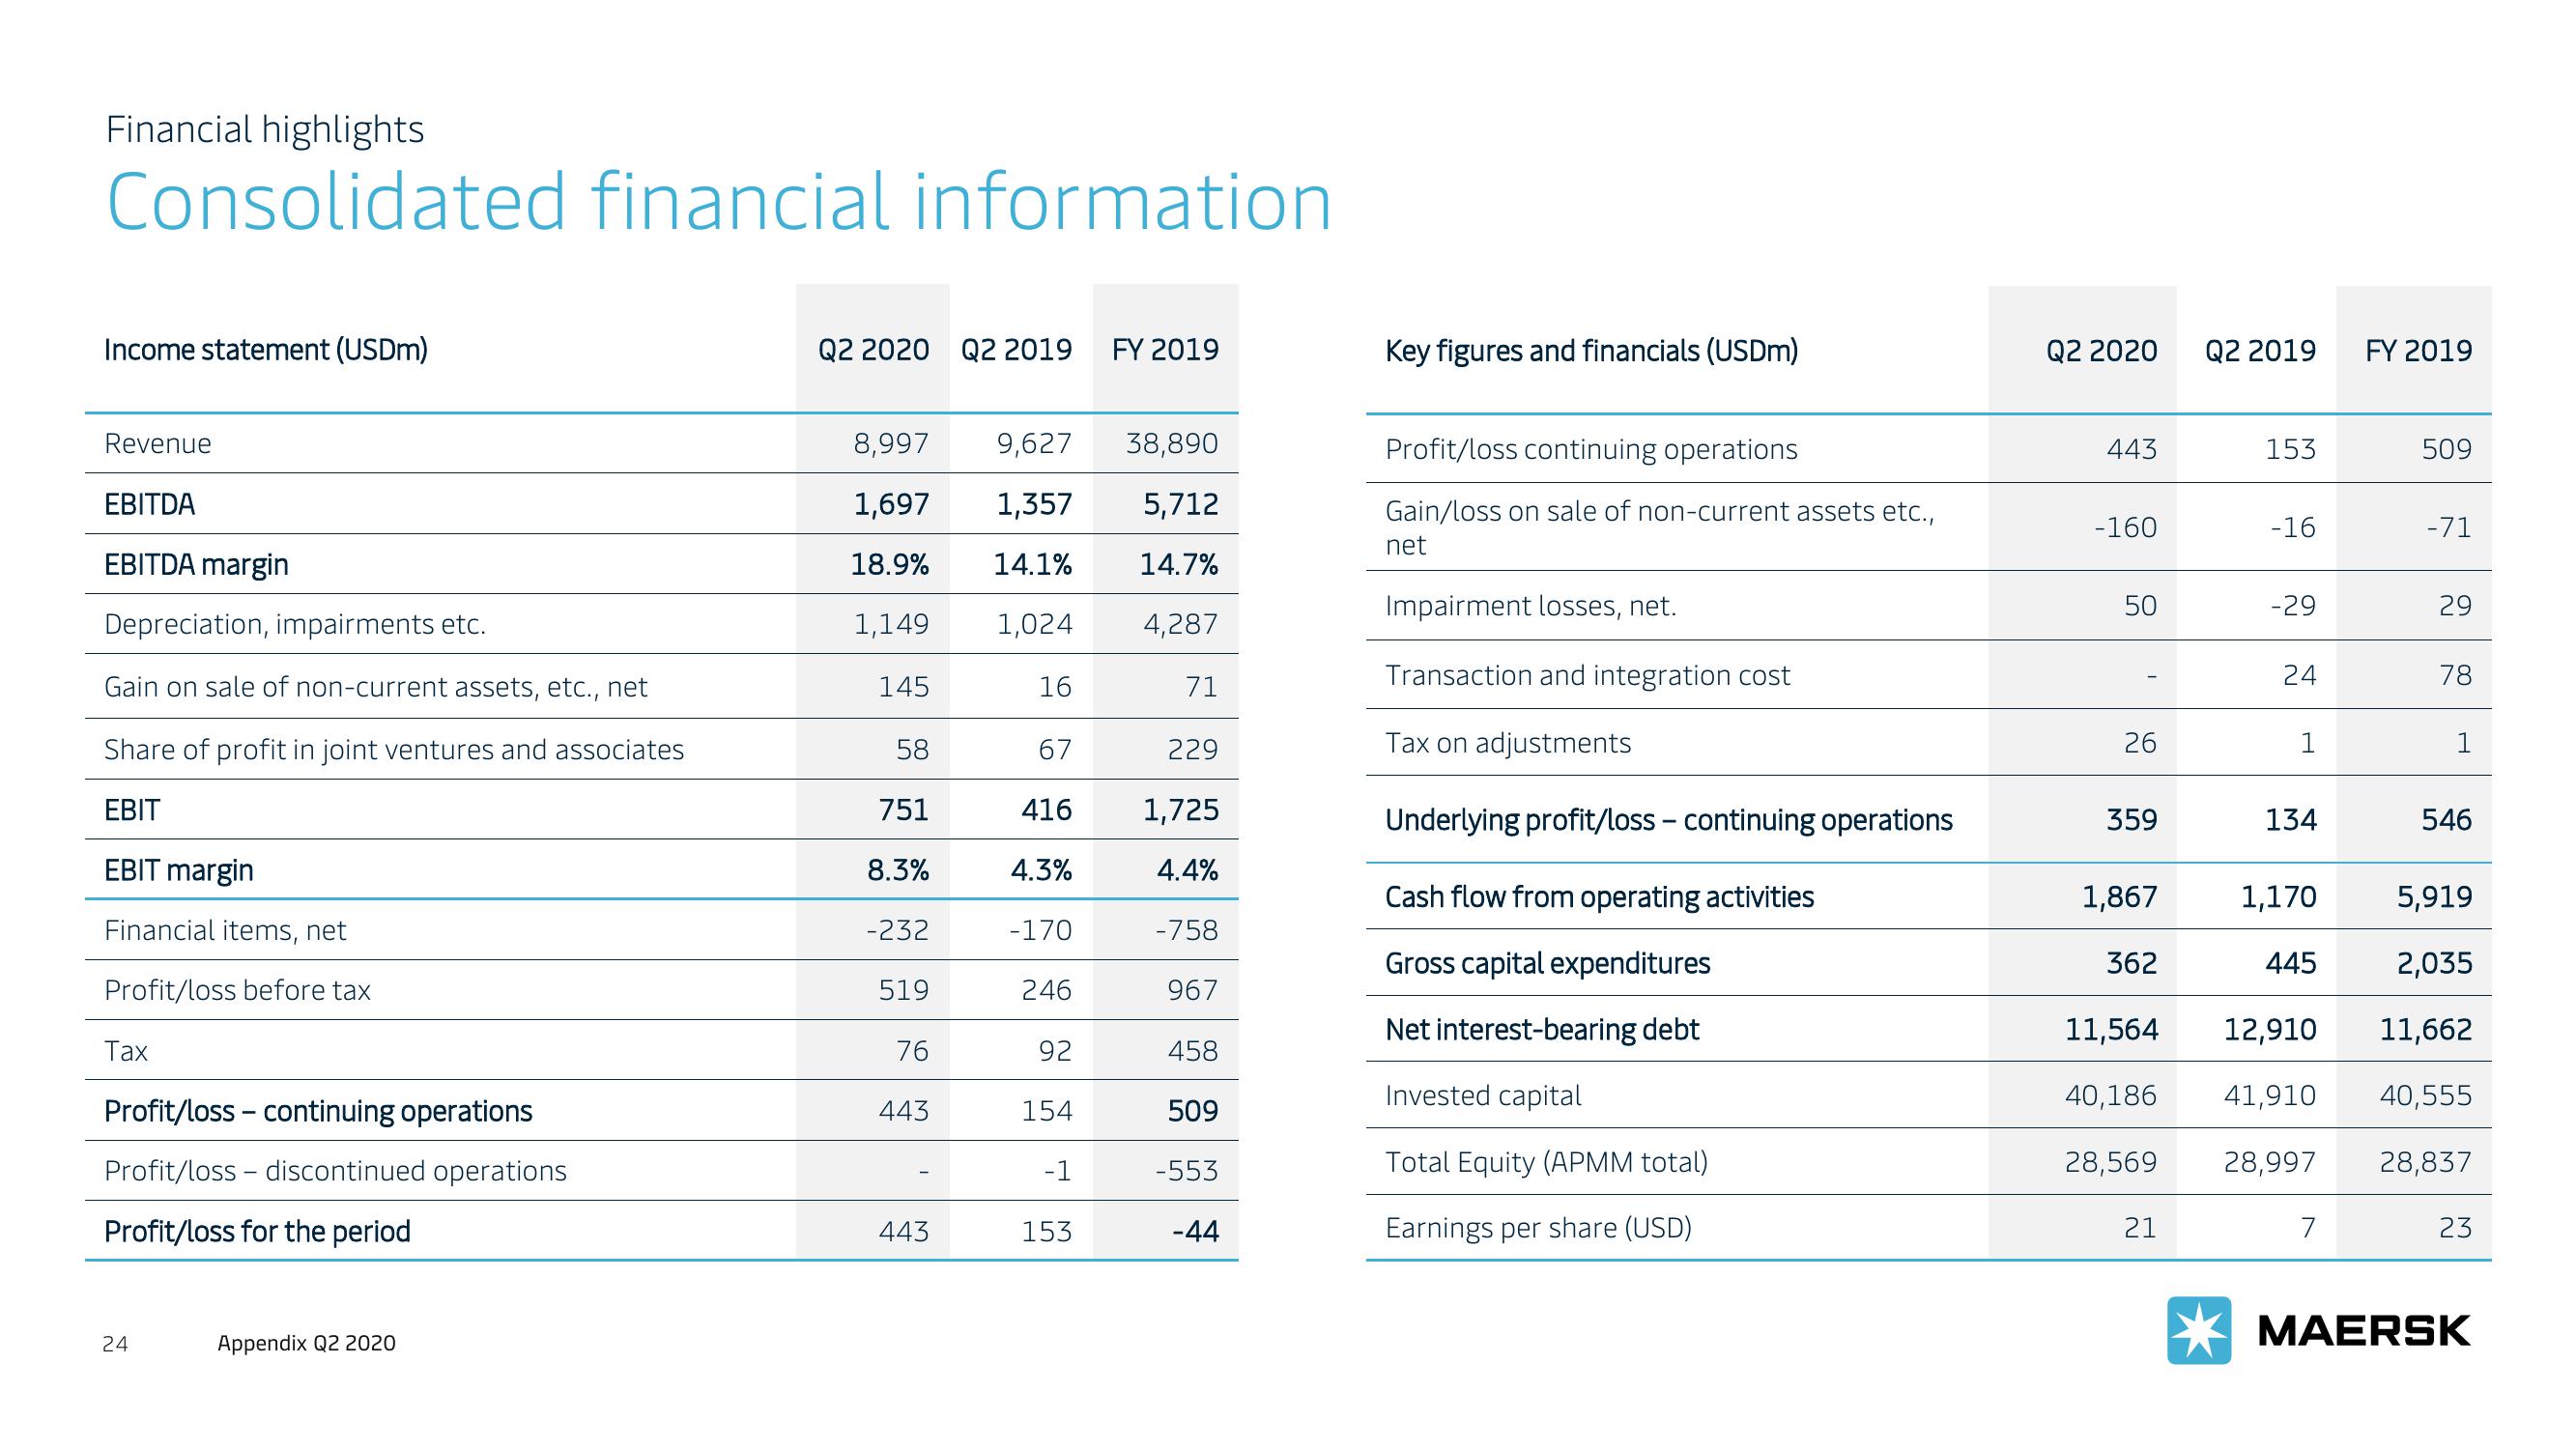
Income statement (USDm)
Revenue
EBITDA
EBITDA margin
Depreciation, impairments etc.
Gain on sale of non-current assets, etc., net
Share of profit in joint ventures and associates
EBIT
EBIT margin
Financial items, net
Profit/loss before tax
Tax
Profit/loss - continuing operations
Profit/loss discontinued operations
Profit/loss for the period
24
Appendix Q2 2020
Q2 2020 Q2 2019
8,997 9,627 38,890
1,697
1,357
5,712
18.9%
14.1%
14.7%
1,149
4,287
145
58
751
8.3%
-232
519
76
443
443
1,024
16
67
416
4.3%
-170
246
92
154
-1
FY 2019
153
71
229
1,725
4.4%
-758
967
458
509
-553
-44
Key figures and financials (USDm)
Profit/loss continuing operations
Gain/loss on sale of non-current assets etc.,
net
Impairment losses, net.
Transaction and integration cost
Tax on adjustments
Underlying profit/loss - continuing operations
Cash flow from operating activities
Gross capital expenditures
Net interest-bearing debt
Invested capital
Total Equity (APMM total)
Earnings per share (USD)
Q2 2020
443
-160
50
26
359
1,867
362
Q2 2019
21
153
-16
-29
24
1
134
1,170
445
12,910
11,564
40,186 41,910
28,569 28,997
7
FY 2019
509
-71
29
78
1
546
5,919
2,035
11,662
40,555
28,837
23
MAERSKView entire presentation