First Merchants Results Presentation Deck
Loan Portfolio Insights (continued)
Balance:
Commitment:
# of loans:
% of Total Loans:
Average Loan Balance:
Top 10 - Avg. Loan Com:
Office % Total Loans
Total Loans
$12.5
Billion
Commercial Real Estate (Non-Owner Occupied) ($M)
Warehouse
/ Storage
Multi-
Family
$724.0
$755.3
478
5.8%
$1.5
$18.8
Non-Office
CRE (NOO),
17.2%
Industrial Retail
$384.3
$398.9
492
3.1%
$0.8
$8.8
Office
CRE
2.0%
$348.4
$353.6
311
General Office
Medical
Mixed
Government
Other
2.8%
$1.1
$8.7
Multi Tenant
Single Tenant
Michigan
Indiana
Ohio
Oklahoma
Illinois
Other
First Merchants Corporation
Helping you prosper
Office
Office (Non-Owner Occupied) ($M)
Office Type
$253.4
$258.1
217
2.0%
Office Tenant Classification
$1.2
$10.7
Office Geographic
$122.4
$71.4
$19.0
$20.9
$19.7
$151.8
$101.6
$93.4
$65.6
$28.6
$25.0
$23.8
$17.0
Hotel
$241.8 $148.7
$255.3
98
1.9%
$2.5
$14.4
Total CRE
(NOO)
$300.2
$2,400.8
$149.2 $323.4 $2,493.8
32
119
1.2%
2.4%
$4.6
$2.5
$11.7
$18.0
Other
Office Maturities
Over 5
yrs.
44.4%
<= 1
7.0%
Office
Maturities
$253.4
Million
1747
19.2%
$1.4
$23.9
1-3 yrs.
23.7%
3-5 yrs.
24.9%
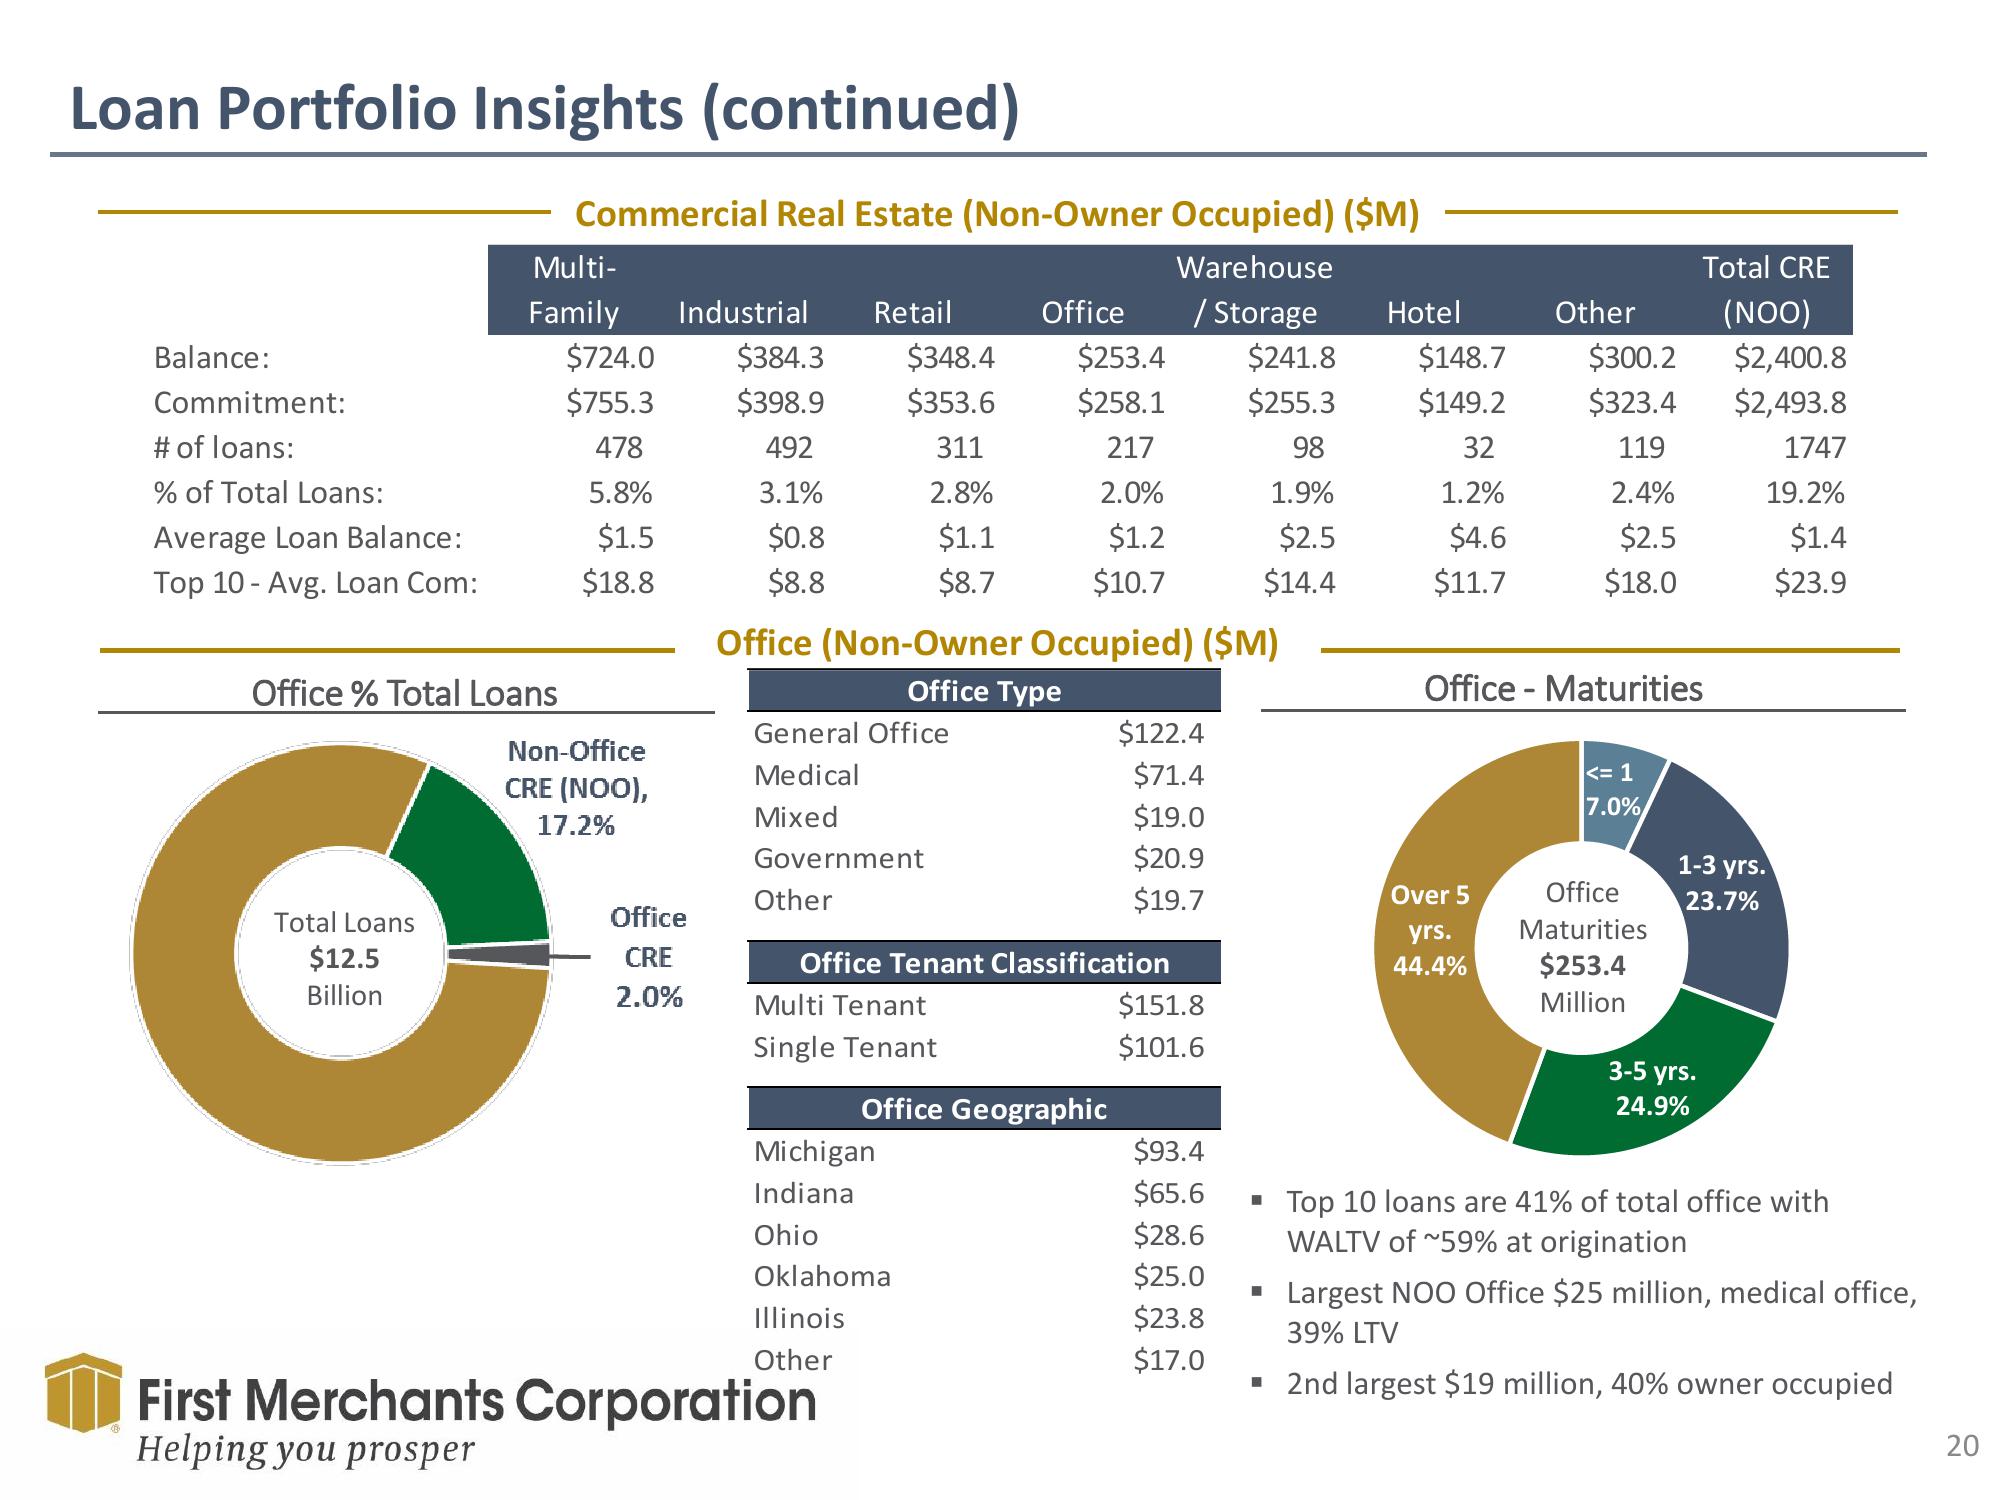
Top 10 loans are 41% of total office with
WALTV of ~59% at origination
Largest NOO Office $25 million, medical office,
39% LTV
▪ 2nd largest $19 million, 40% owner occupied
20View entire presentation