SoftBank Results Presentation Deck
SoftBank Vision Funds Segment
P/L
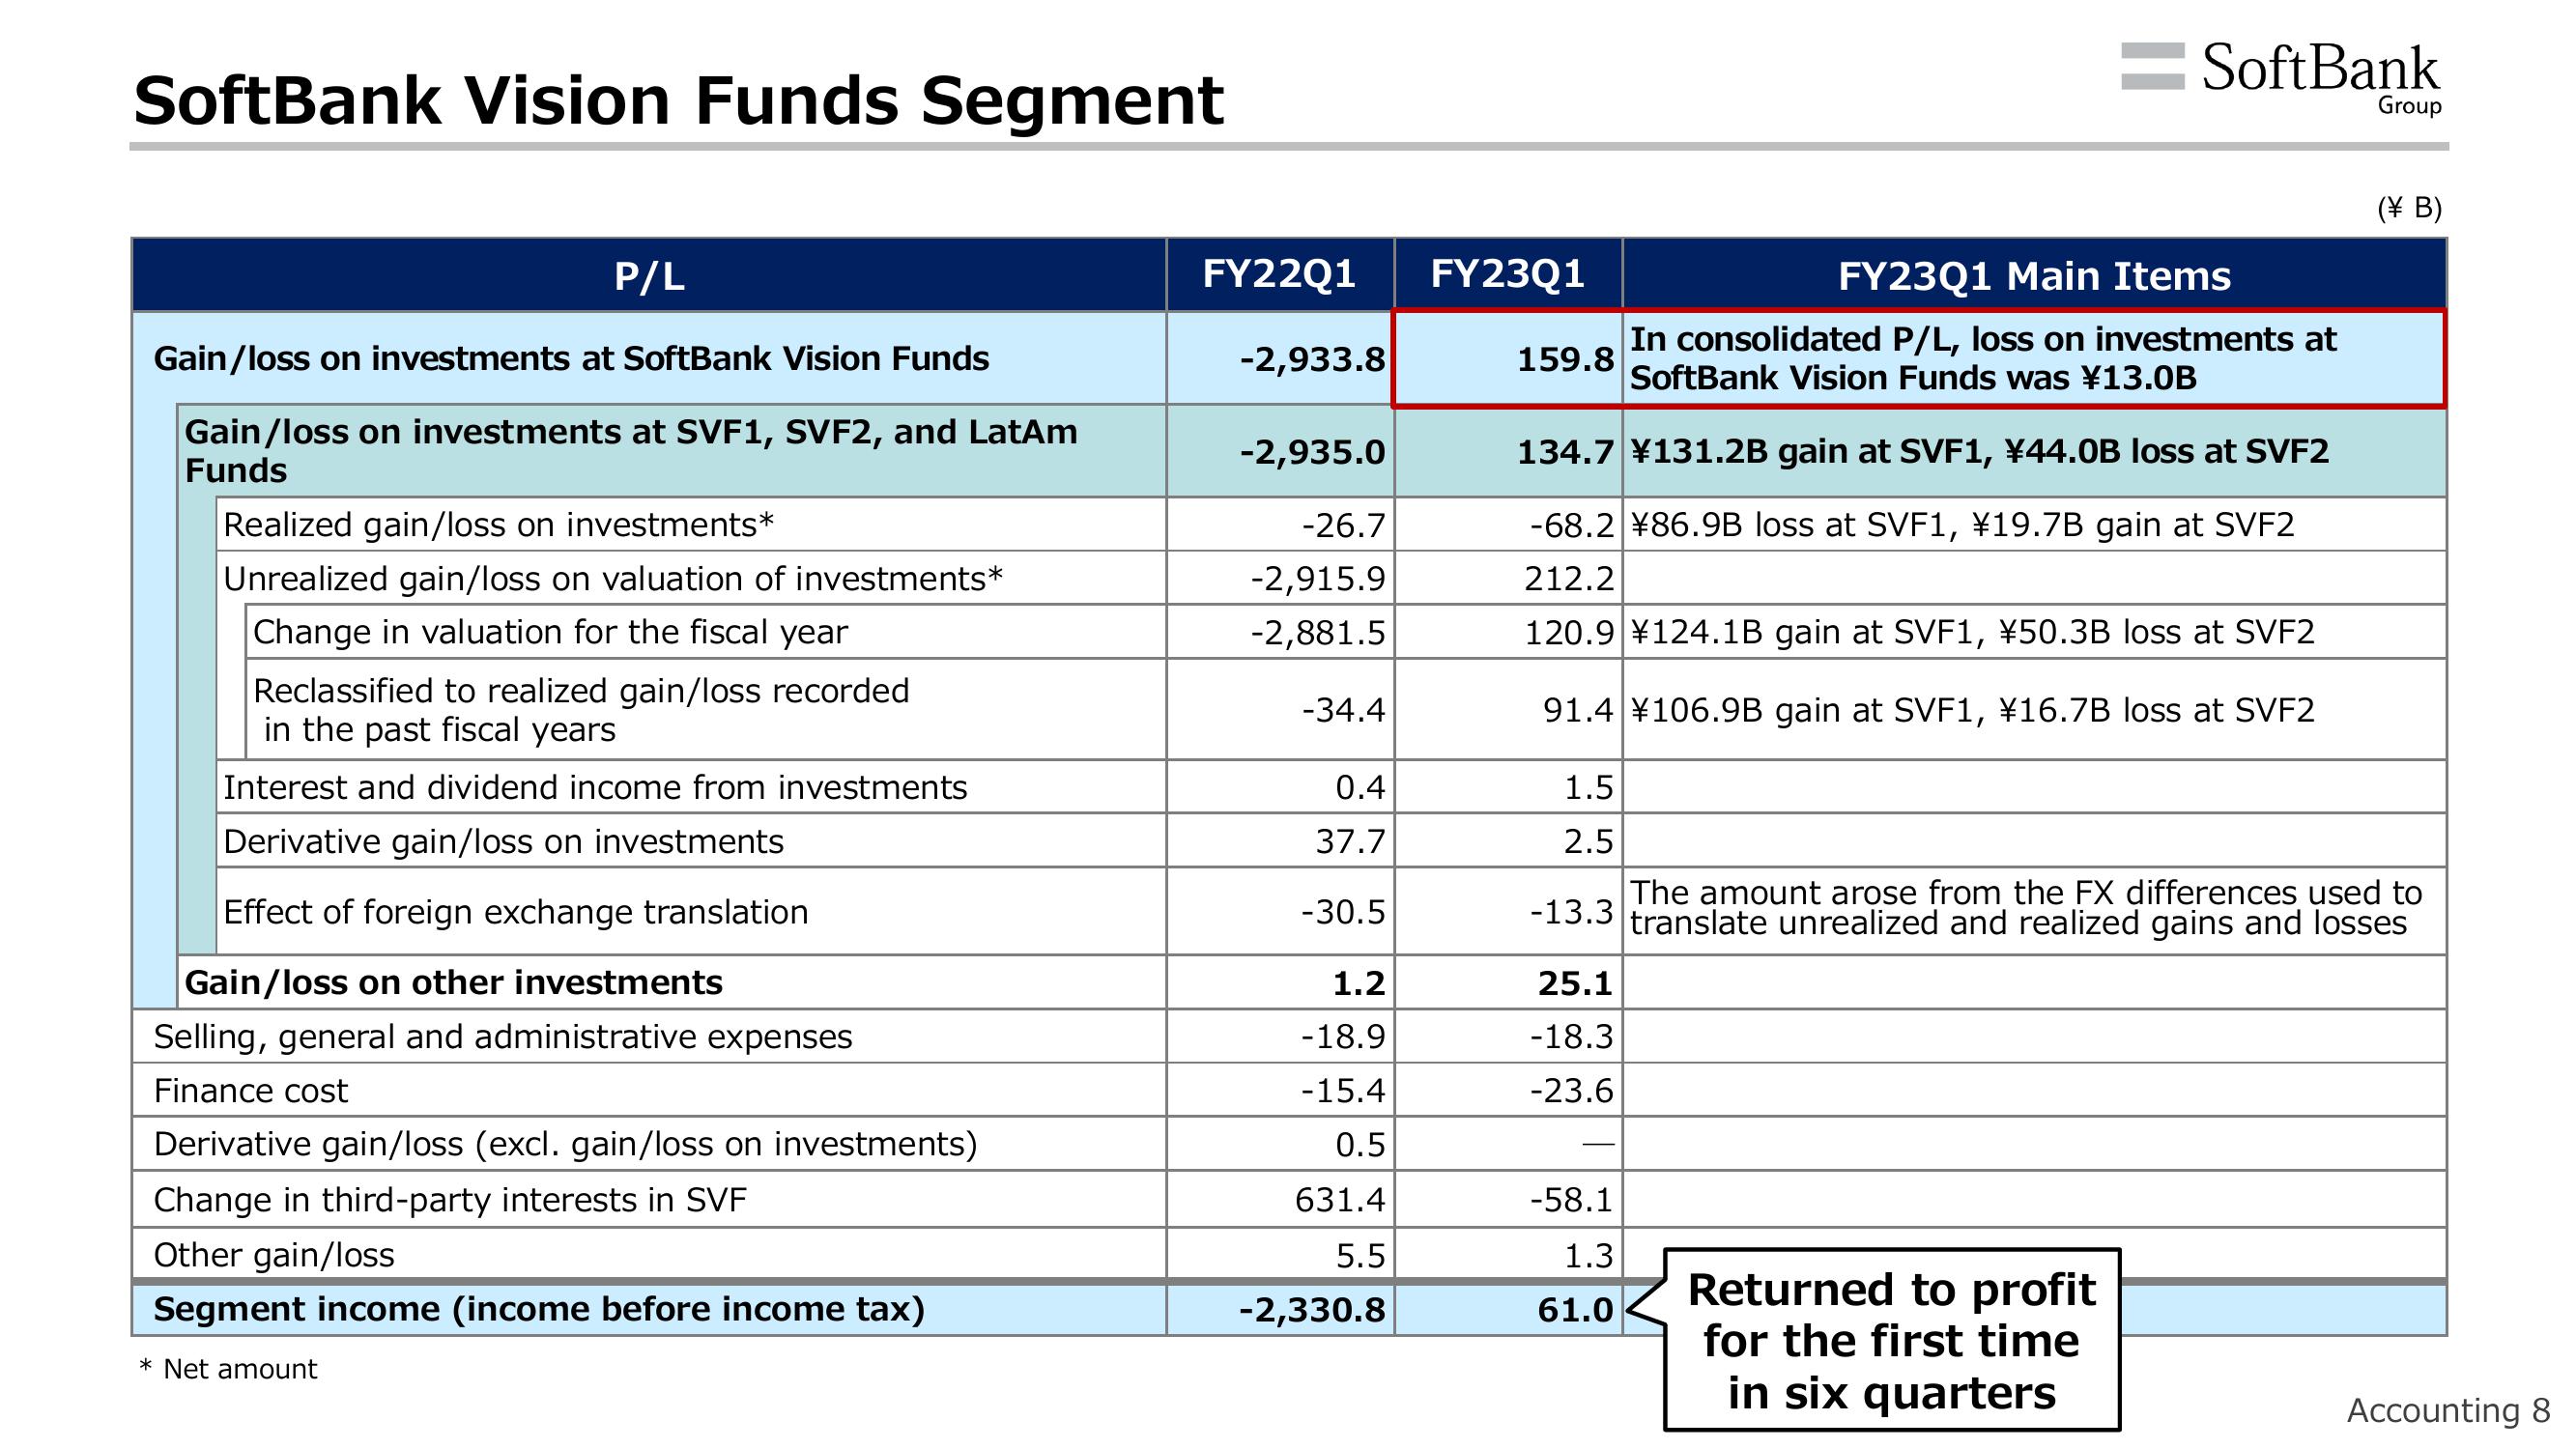
Gain/loss on investments at SoftBank Vision Funds
Gain/loss on investments at SVF1, SVF2, and LatAm
Funds
Realized gain/loss on investments*
Unrealized gain/loss on valuation of investments*
Change in valuation for the fiscal year
Reclassified to realized gain/loss recorded
in the past fiscal years
Interest and dividend income from investments
Derivative gain/loss on investments
Effect of foreign exchange translation
Gain/loss on other investments
Selling, general and administrative expenses
Finance cost
Derivative gain/loss (excl. gain/loss on investments)
Change in third-party interests in SVF
Other gain/loss
Segment income (income before income tax)
* Net amount
FY22Q1 FY23Q1
-2,933.8
-2,935.0
-26.7
-2,915.9
-2,881.5
-34.4
0.4
37.7
-30.5
1.2
-18.9
-15.4
0.5
631.4
5.5
-2,330.8
159.8
1.5
2.5
134.7 ¥131.2B gain at SVF1, ¥44.0B loss at SVF2
-68.2 ¥86.9B loss at SVF1, ¥19.7B gain at SVF2
212.2
120.9 ¥124.1B gain at SVF1, ¥50.3B loss at SVF2
91.4 ¥106.9B gain at SVF1, ¥16.7B loss at SVF2
25.1
-18.3
-23.6
SoftBank
FY23Q1 Main Items
In consolidated P/L, loss on investments at
SoftBank Vision Funds was ¥13.0B
-58.1
1.3
61.0
The amount arose from the FX differences used to
-13.3 translate unrealized and realized gains and losses
Returned to profit
for the first time
in six quarters
Group
(¥ B)
Accounting 8View entire presentation