Allbirds Investor Presentation Deck
INVESTOR OVERVIEW
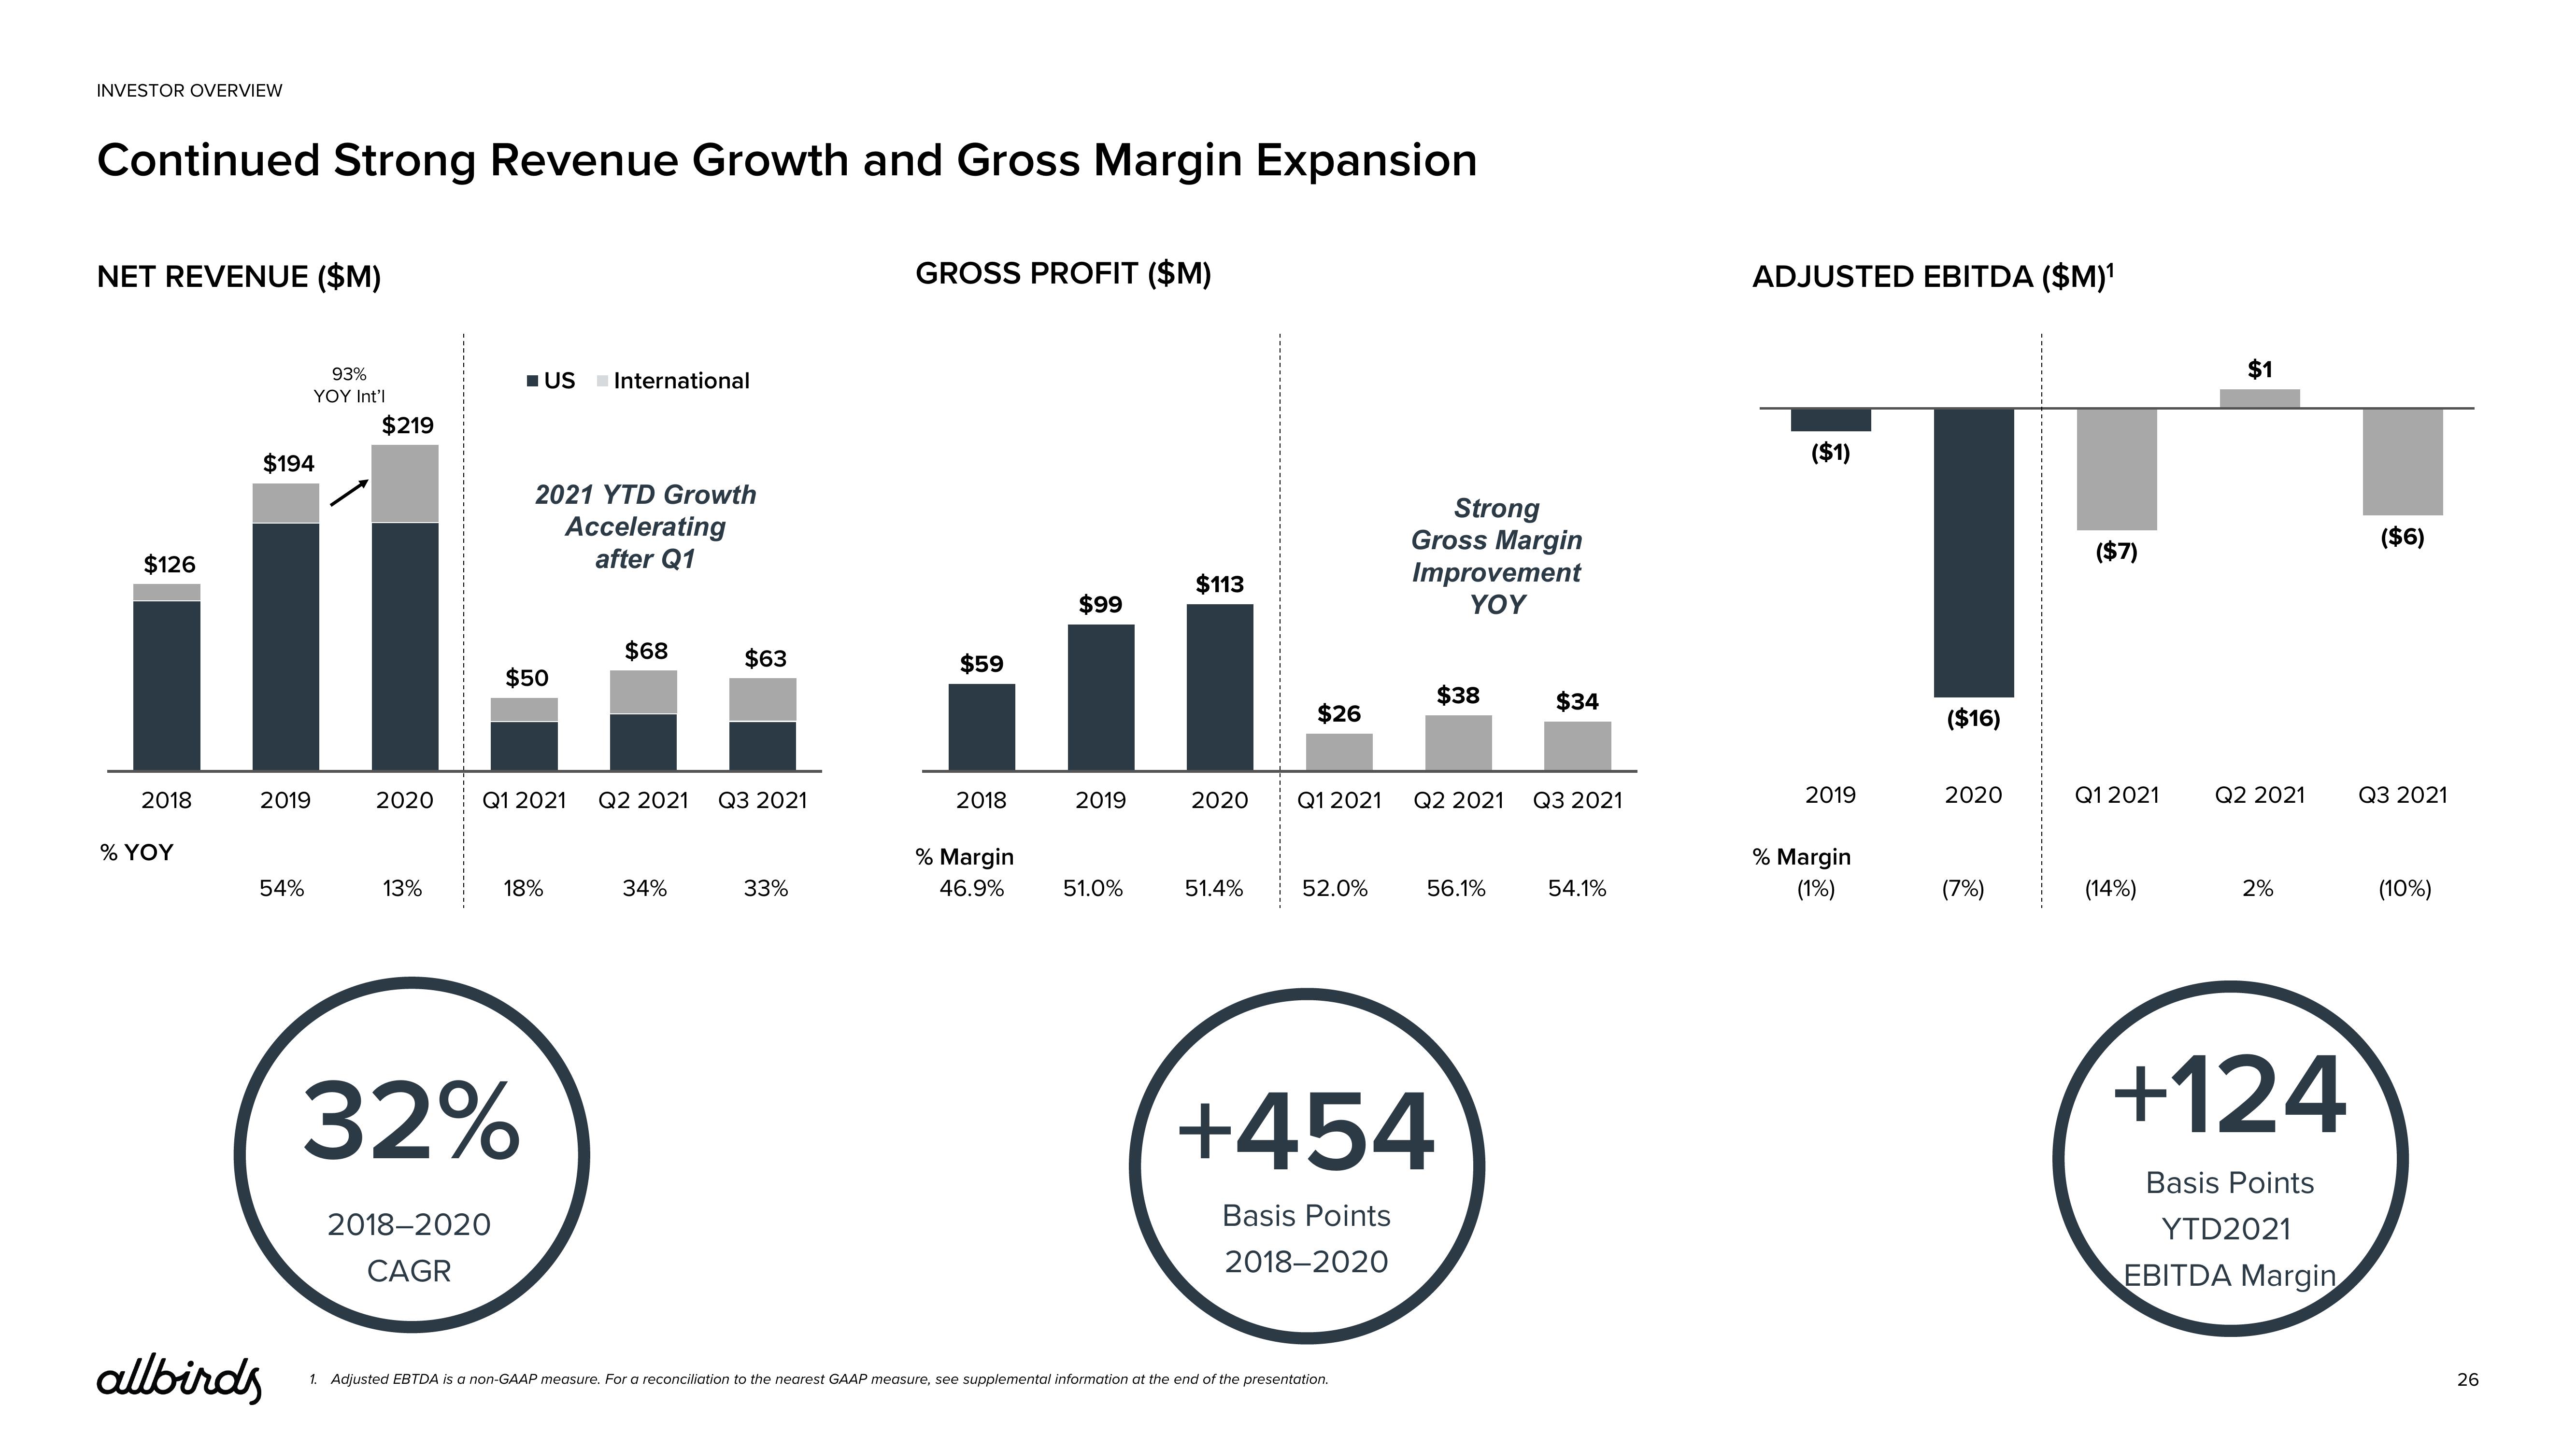
Continued Strong Revenue Growth and Gross Margin Expansion
NET REVENUE ($M)
$126
2018
% YOY
$194
2019
54%
93%
YOY Int'l
allbirds
$219
13%
2018-2020
CAGR
US International
2021 YTD Growth
Accelerating
after Q1
$50
32%
2020 Q1 2021 Q2 2021 Q3 2021
18%
$68
$63
34%
33%
GROSS PROFIT ($M)
$59
2018
% Margin
46.9%
$99
2019
51.0%
$113
2020
51.4%
$26
Q1 2021
52.0%
Strong
Gross Margin
Improvement
YOY
1. Adjusted EBTDA is a non-GAAP measure. For a reconciliation to the nearest GAAP measure, see supplemental information at the end of the presentation.
$38
+454
Basis Points
2018-2020
Q2 2021 Q3 2021
56.1%
$34
54.1%
ADJUSTED EBITDA ($M)¹
($1)
2019
% Margin
(1%)
($16)
2020
(7%)
($7)
Q1 2021
(14%)
$1
Q2 2021
2%
+124
Basis Points
YTD2021
EBITDA Margin
($6)
Q3 2021
(10%)
26View entire presentation