Fourth Quarter and Fiscal Year 2023 Financial Results
11
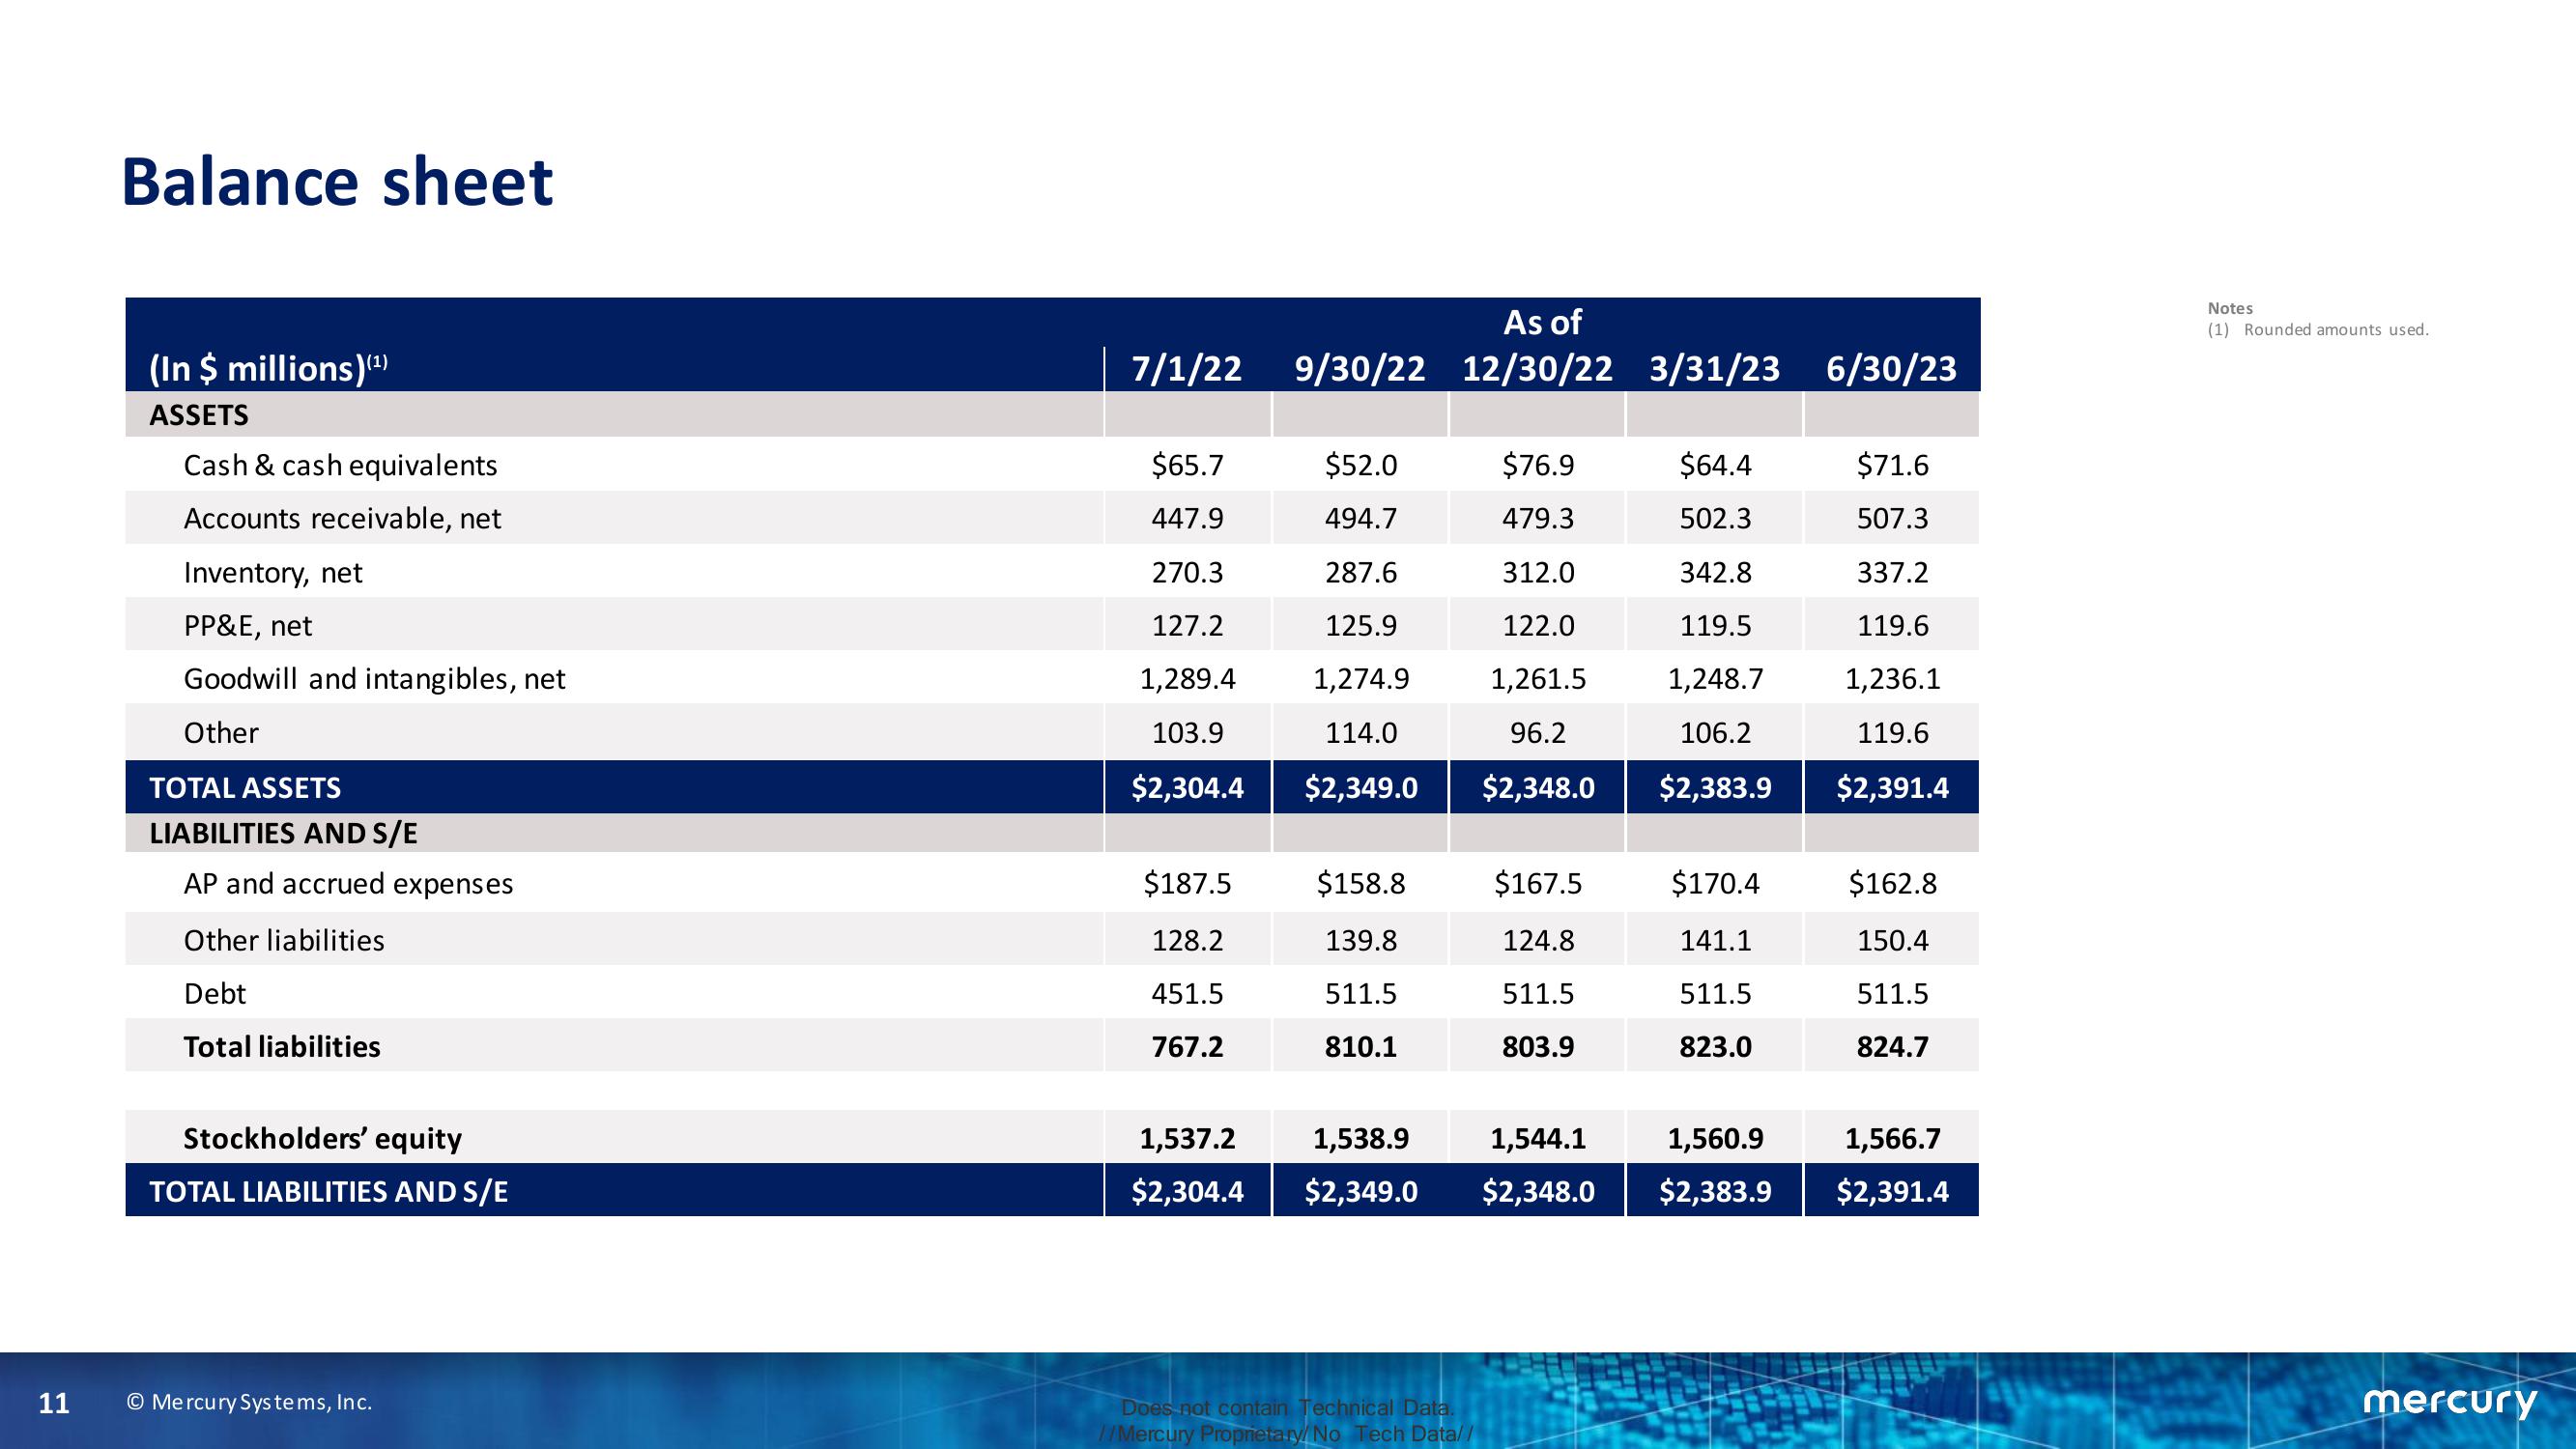
Balance sheet
(In $ millions) (¹)
ASSETS
Cash & cash equivalents
Accounts receivable, net
Inventory, net
PP&E, net
Goodwill and intangibles, net
Other
TOTAL ASSETS
LIABILITIES AND S/E
AP and accrued expenses
Other liabilities
Debt
Total liabilities
Stockholders' equity
TOTAL LIABILITIES AND S/E
© Mercury Systems, Inc.
As of
7/1/22 9/30/22 12/30/22 3/31/23 6/30/23
$65.7
$52.0
447.9
494.7
270.3
287.6
127.2
125.9
1,289.4
1,274.9
103.9
114.0
$2,304.4 $2,349.0
$187.5
128.2
451.5
767.2
$158.8
139.8
511.5
810.1
1,537.2
1,538.9
$2,304.4 $2,349.0
Does not contain Technical Data.
//Mercury Proprietary/No Tech Data//
$76.9
479.3
312.0
122.0
1,261.5
96.2
$2,348.0
$167.5
124.8
511.5
803.9
$64.4
502.3
342.8
119.5
1,248.7
106.2
$2,383.9
$170.4
141.1
511.5
823.0
1,544.1
1,560.9
$2,348.0 $2,383.9
$71.6
507.3
337.2
119.6
1,236.1
119.6
$2,391.4
$162.8
150.4
511.5
824.7
1,566.7
$2,391.4
Notes
(1) Rounded amounts used.
mercuryView entire presentation