Benson Hill SPAC Presentation Deck
BENSON HILL
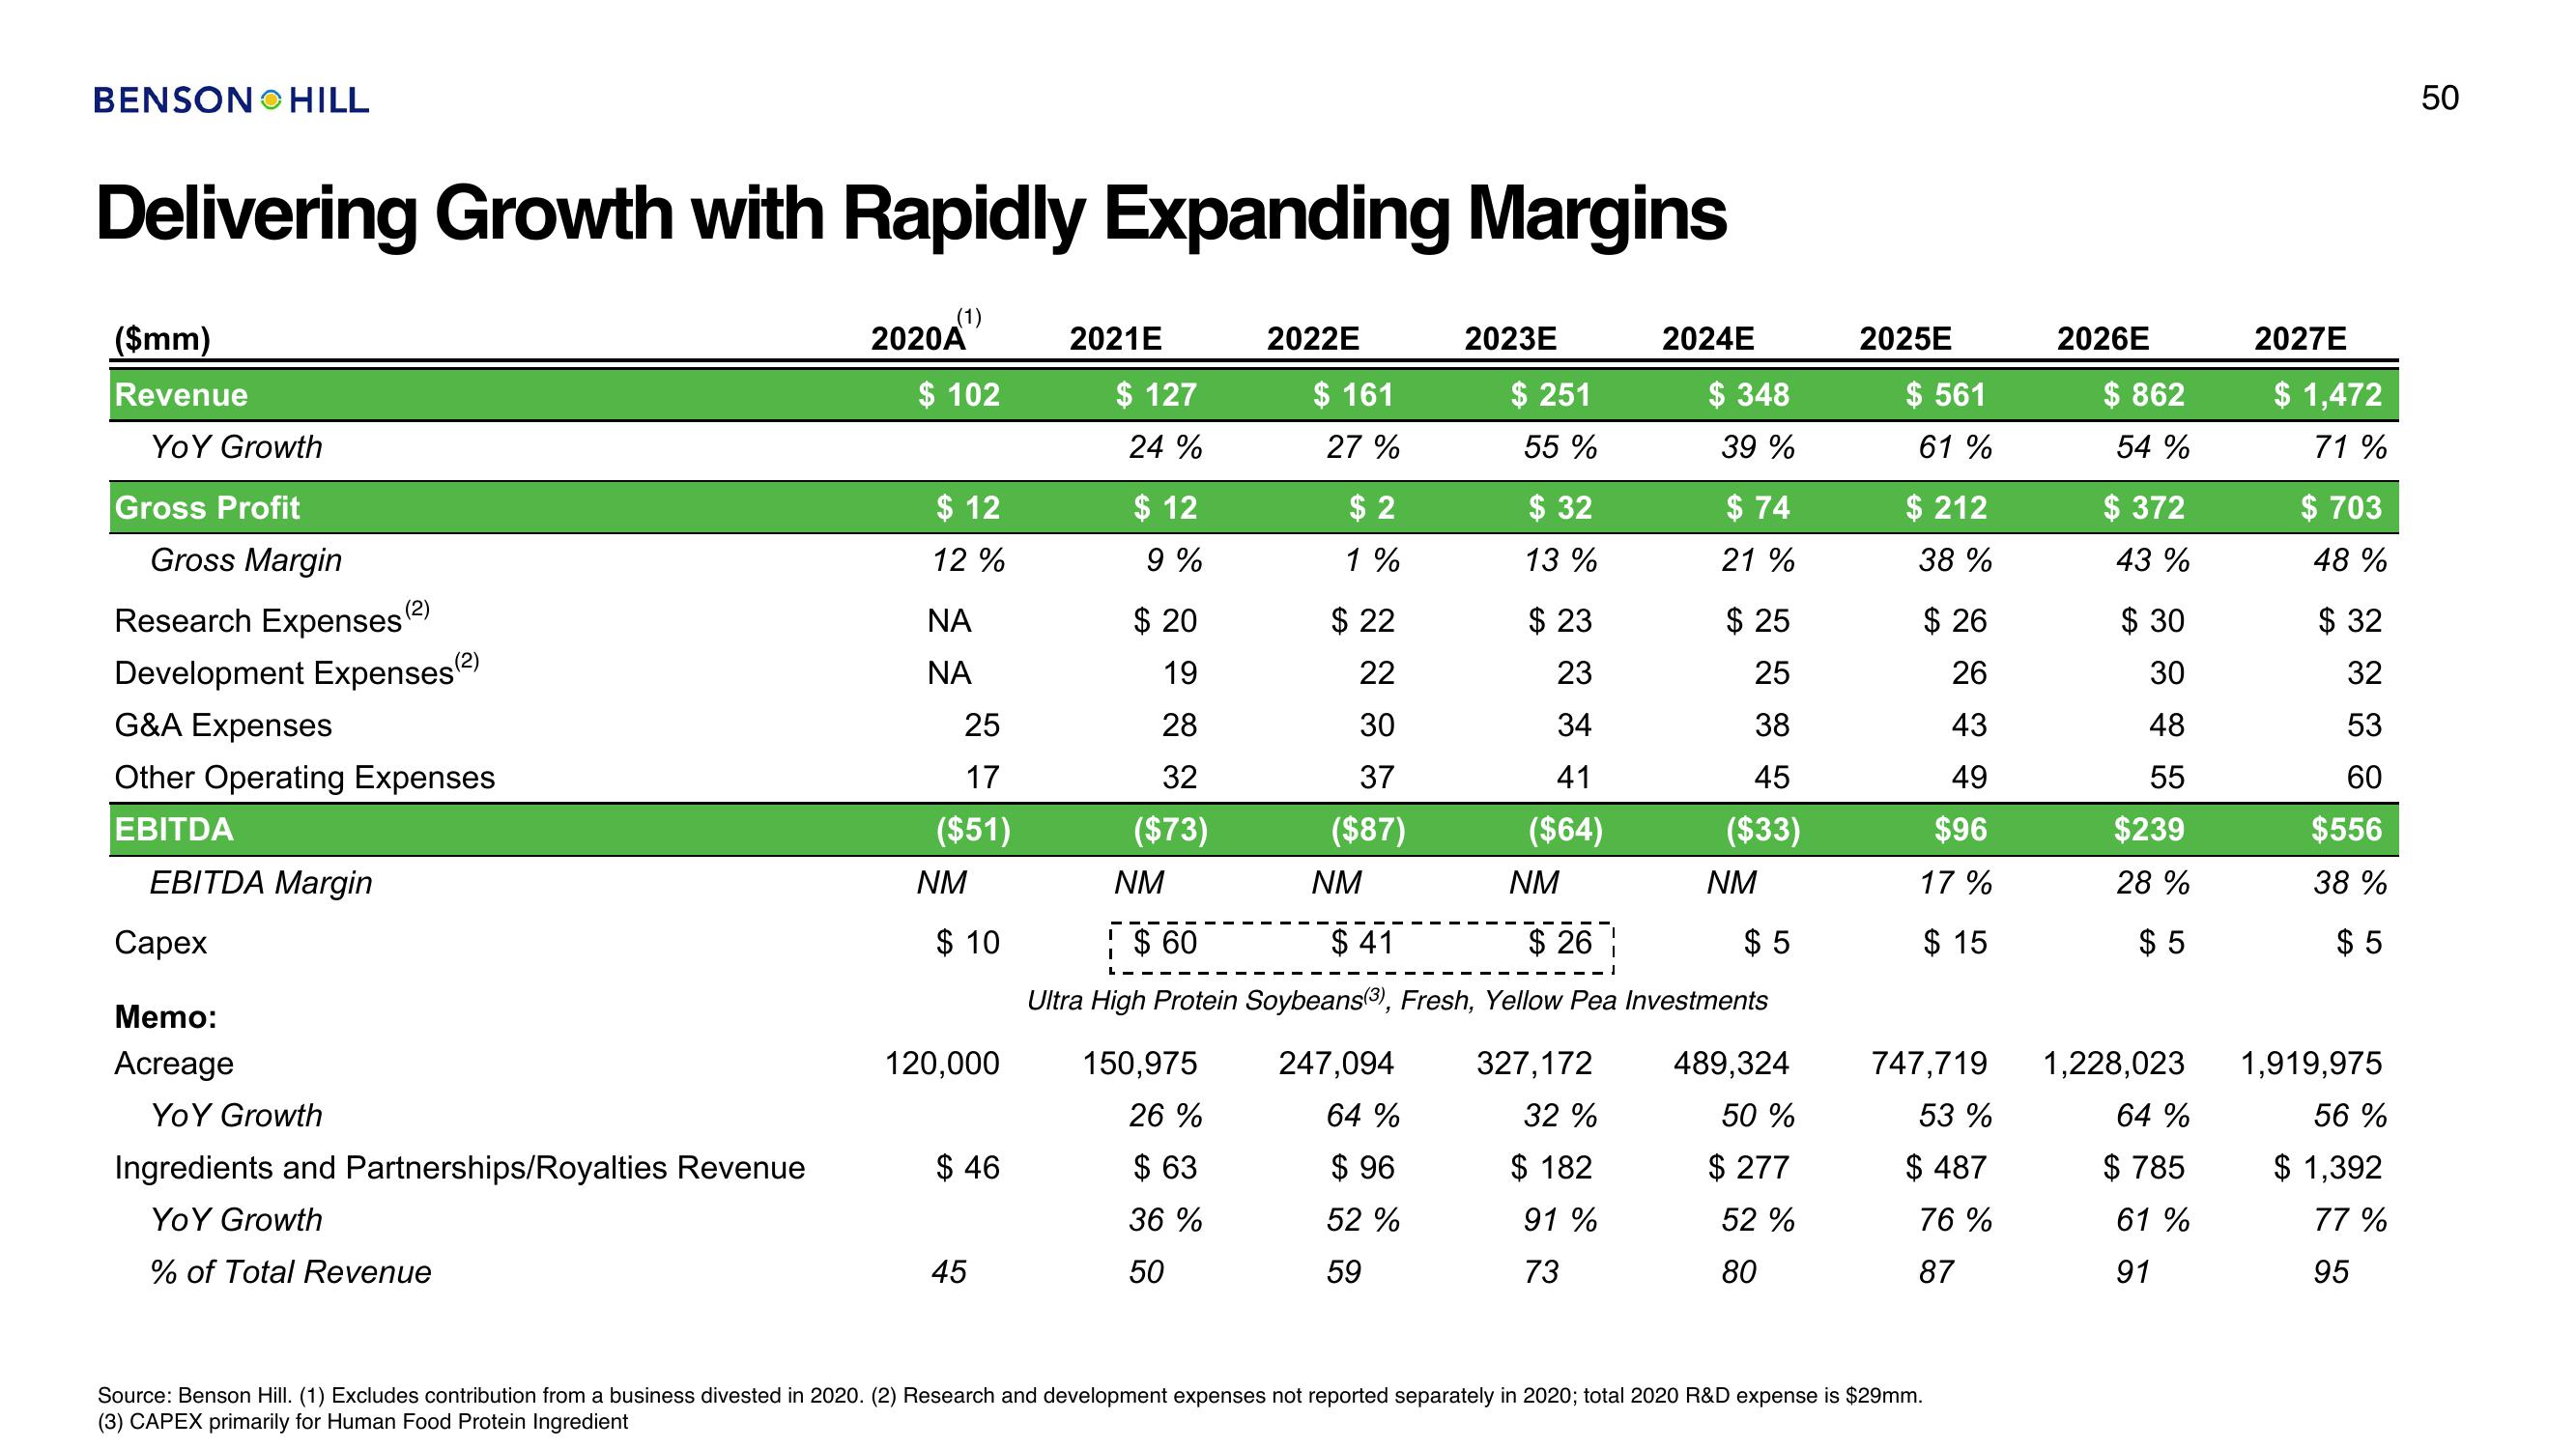
Delivering Growth with Rapidly Expanding Margins
($mm)
Revenue
YoY Growth
Gross Profit
Gross Margin
Research Expenses
Development Expenses (²)
G&A Expenses
Other Operating Expenses
EBITDA
EBITDA Margin
Capex
Memo:
Acreage
(2)
YoY Growth
Ingredients and Partnerships/Royalties Revenue
Yo Y Growth
% of Total Revenue
2020A
$ 102
$ 12
12%
ΝΑ
ΝΑ
25
17
($51)
NM
$10
120,000
$ 46
45
2021E
$ 127
24 %
$ 12
9%
$20
19
28
32
($73)
NM
¦ $ 60
I
2022E
150,975
26%
$63
36%
50
$ 161
27%
$2
1%
$22
22
30
37
($87)
NM
$41
2023E
247,094
64 %
$96
52%
59
$ 251
55 %
$ 32
13%
$23
23
34
41
($64)
NM
2024E
$26
Ultra High Protein Soybeans(3), Fresh, Yellow Pea Investments
327,172
32 %
$ 182
91%
73
$ 348
39 %
$ 74
21 %
$ 25
25
38
45
($33)
NM
$5
489,324
50 %
$277
52%
80
2025E
$ 561
61%
$ 212
38 %
$ 26
26
43
49
$96
17%
$15
747,719
53 %
$ 487
76%
87
Source: Benson Hill. (1) Excludes contribution from a business divested in 2020. (2) Research and development expenses not reported separately in 2020; total 2020 R&D expense is $29mm.
(3) CAPEX primarily for Human Food Protein Ingredient
2026E
$ 862
54%
$ 372
43%
$30
30
48
55
$239
28%
$5
1,228,023
64 %
$ 785
61 %
91
2027E
$ 1,472
71%
$ 703
48 %
$32
32
53
60
$556
38 %
$5
1,919,975
56 %
$ 1,392
77%
95
50View entire presentation