Bed Bath & Beyond Results Presentation Deck
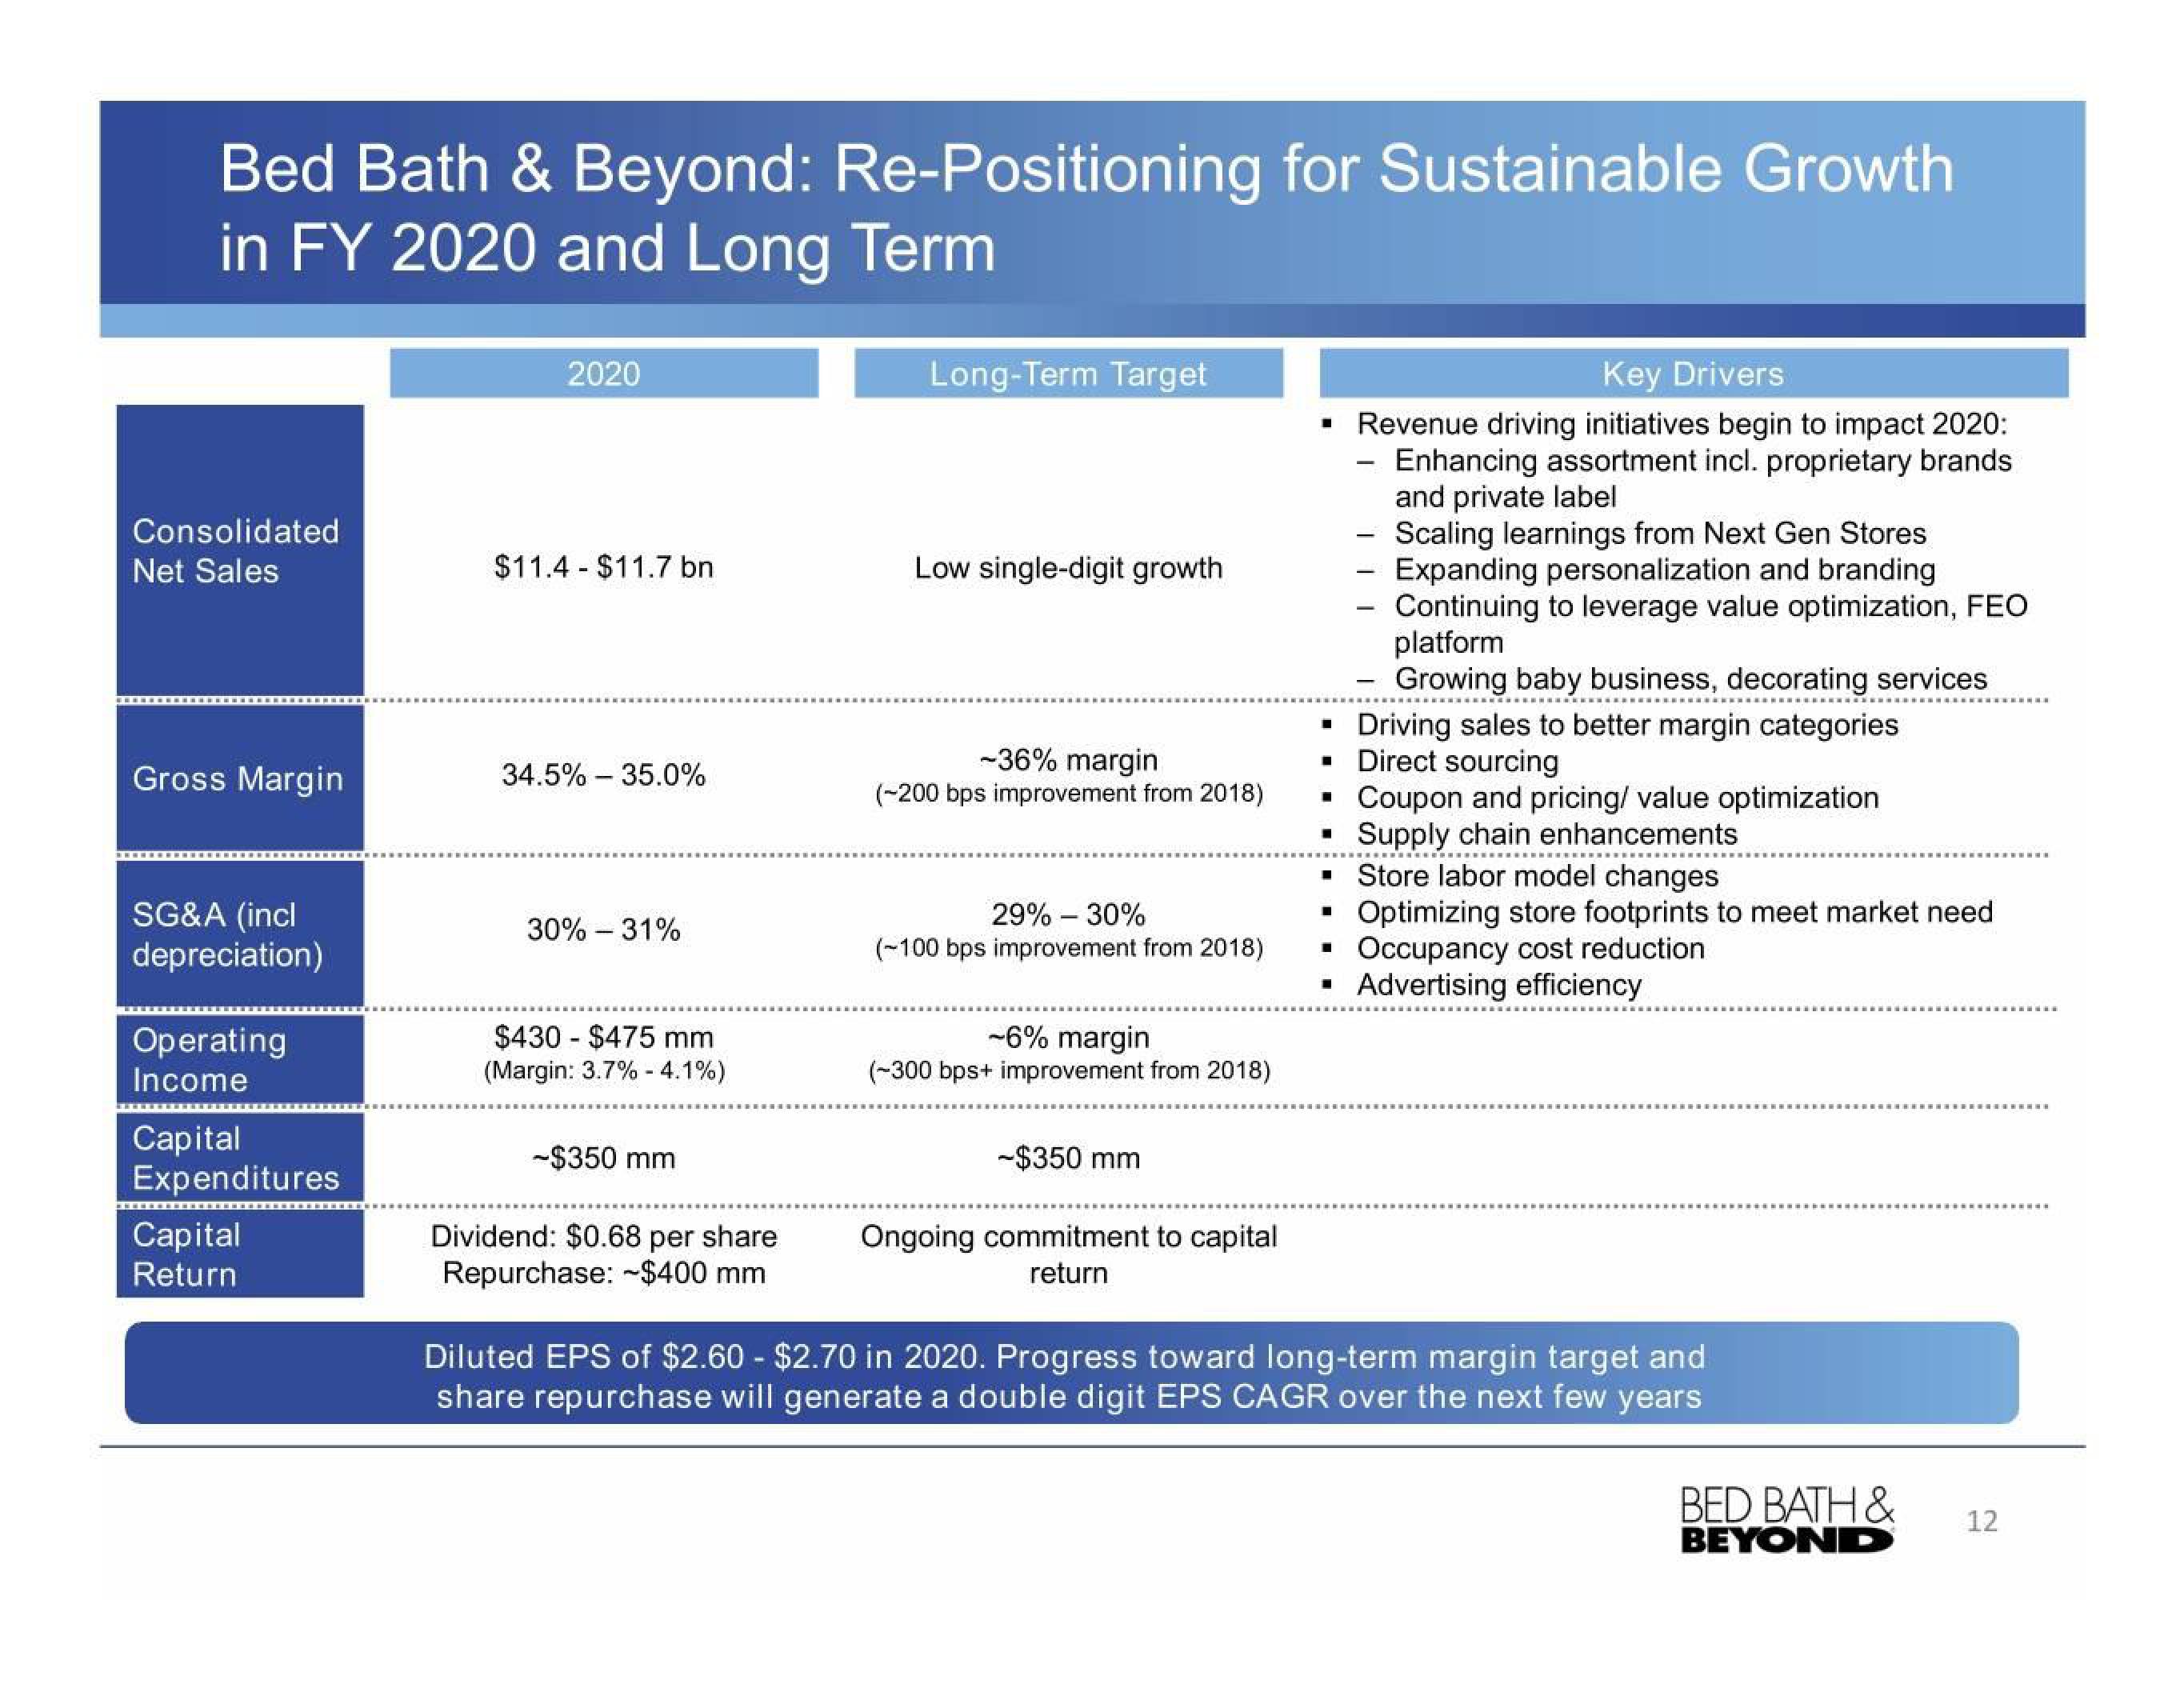
Bed Bath & Beyond: Re-Positioning for Sustainable Growth
in FY 2020 and Long Term
Consolidated
Net Sales
Gross Margin
SG&A (incl
depreciation)
Operating
Income
Capital
Expenditures
Capital
Return
2020
$11.4 $11.7 bn
-
34.5% - 35.0%
30% -31%
$430 $475 mm
(Margin: 3.7% -4.1%)
-$350 mm
Dividend: $0.68 per share
Repurchase: $400 mm
Long-Term Target
Low single-digit growth
-36% margin
(-200 bps improvement from 2018)
29% - 30%
(~100 bps improvement from 2018)
~6% margin
(-300 bps+ improvement from 2018)
-$350 mm
Ongoing commitment to capital
return
Key Drivers
▪ Revenue driving initiatives begin to impact 2020:
Enhancing assortment incl. proprietary brands
and private label
-Scaling learnings from Next Gen Stores
Expanding personalization and branding
Continuing to leverage value optimization, FEO
platform
Growing baby business, decorating services
■
Driving sales to better margin categories
Direct sourcing
Coupon and pricing/ value optimization
Supply chain enhancements
■ Store labor model changes
Optimizing store footprints to meet market need
Occupancy cost reduction
Advertising efficiency
■
■
■
-
■
Diluted EPS of $2.60 - $2.70 in 2020. Progress toward long-term margin target and
share repurchase will generate a double digit EPS CAGR over the next few years
BED BATH &
BEYOND
12View entire presentation