3Q20 Earnings Call Presentation
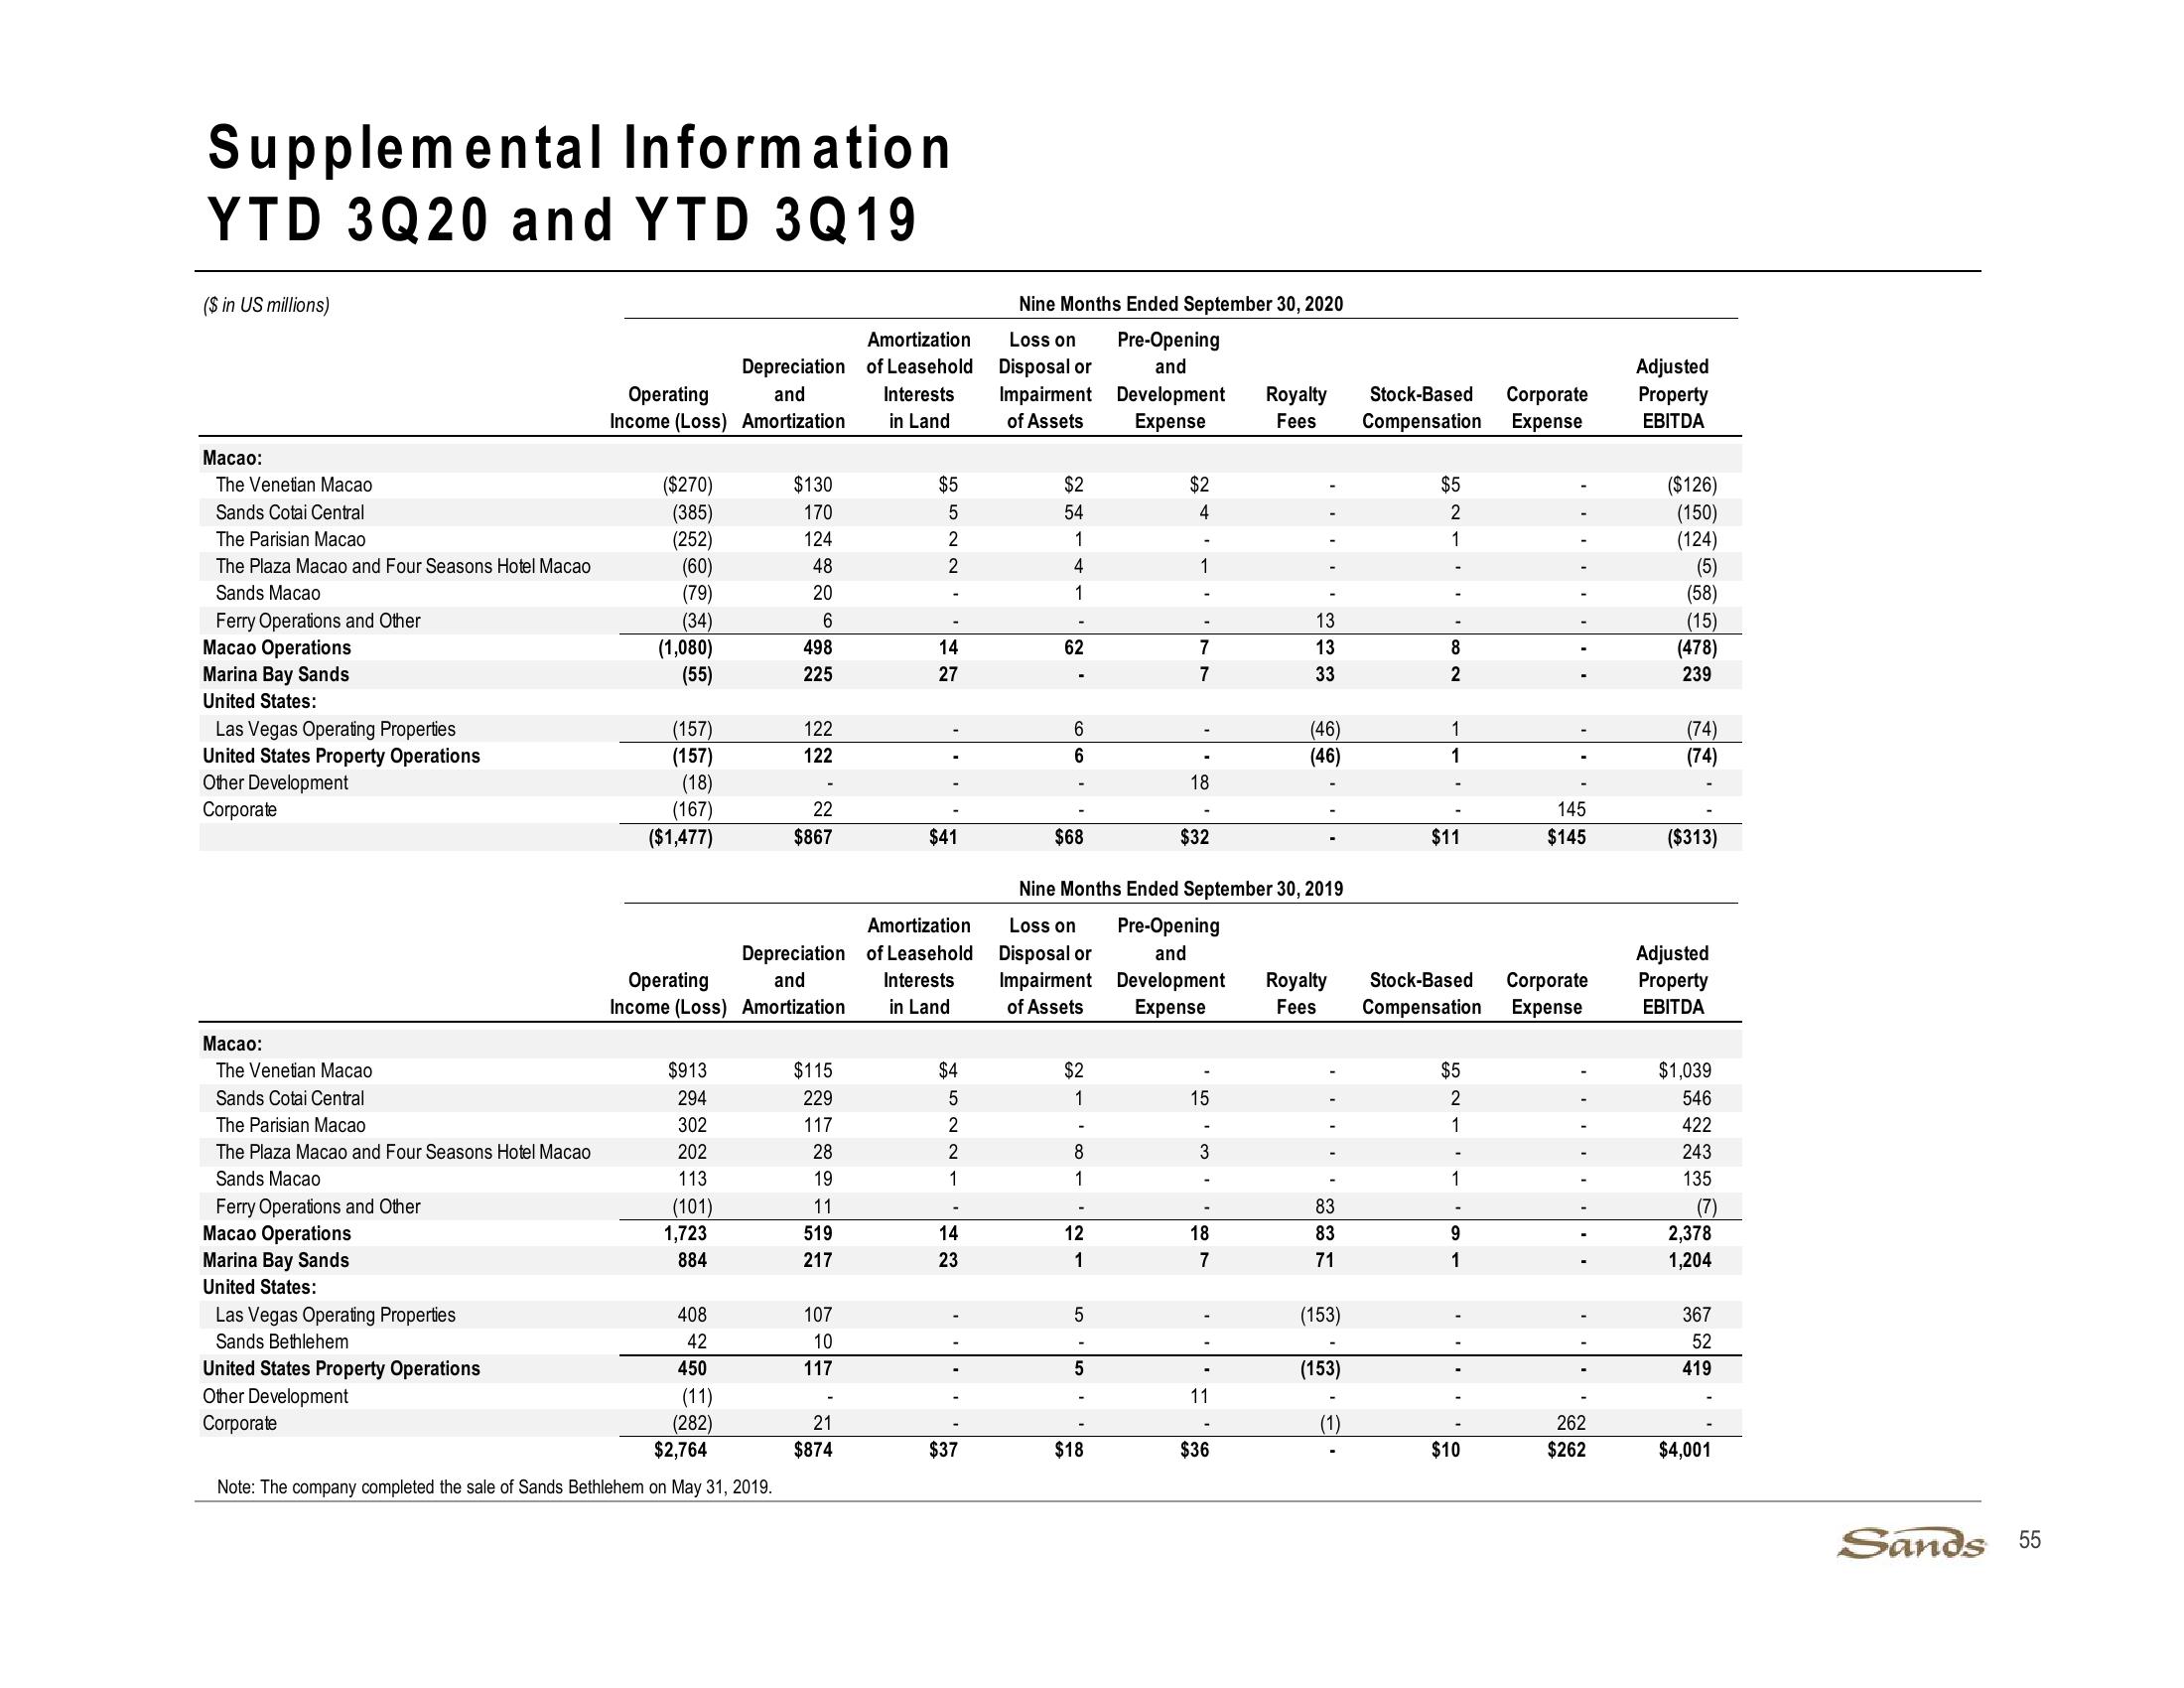
Supplemental Information
YTD 3Q20 and YTD 3Q19
($ in US millions)
Nine Months Ended September 30, 2020
Amortization
Depreciation of Leasehold
Operating
and
Interests
Loss on
Disposal or
Impairment
Income (Loss) Amortization
in Land
of Assets
Pre-Opening
and
Development Royalty
Expense
Fees
Adjusted
Stock-Based Corporate Property
Compensation Expense
EBITDA
Macao:
The Venetian Macao
($270)
$130
Sands Cotai Central
(385)
170
The Parisian Macao
(252)
124
The Plaza Macao and Four Seasons Hotel Macao
(60)
48
5522
$2
$2
54
4
1
4
1
Sands Macao
(79)
20
1
Ferry Operations and Other
(34)
6
-
Macao Operations
(1,080)
498
14
Marina Bay Sands
(55)
225
27
($126)
(150)
(124)
(5)
(58)
-
13
(15)
62
7
13
8
(478)
7
33
2
239
$5
2
1
United States:
Las Vegas Operating Properties
(157)
122
United States Property Operations
(157)
122
Other Development
(18)
6
(46)
1
6
(46)
1
18
Corporate
(167)
22
($1,477)
$867
$41
$68
$32
(74)
(74)
145
$11
$145
($313)
Amortization
Operating
Depreciation of Leasehold
and
Interests
Income (Loss) Amortization in Land
Nine Months Ended September 30, 2019
Loss on
Disposal or
Impairment
of Assets
Pre-Opening
and
Development Royalty
Expense
Fees
Stock-Based Corporate
Compensation Expense
Adjusted
Property
EBITDA
Macao:
The Venetian Macao
$913
$115
$4
Sands Cotai Central
294
229
The Parisian Macao
302
117
The Plaza Macao and Four Seasons Hotel Macao
202
28
1522.
$2
$5
1
15
2
1
8
3
Sands Macao
113
19
1
1
Ferry Operations and Other
(101)
11
Macao Operations
1,723
519
14
12
18
Marina Bay Sands
884
217
23
1
∞ 7
United States:
Las Vegas Operating Properties
408
107
5
Sands Bethlehem
42
10
United States Property Operations
450
117
Other Development
(11)
(153)
5
(153)
11
$1,039
546
422
243
1
135
83
(7)
83
9
2,378
71
1
1,204
367
52
419
Corporate
(282)
21
$2,764
$874
$37
$18
$36
$10
262
$262
$4,001
Note: The company completed the sale of Sands Bethlehem on May 31, 2019.
Sands 55View entire presentation