Deutsche Bank Results Presentation Deck
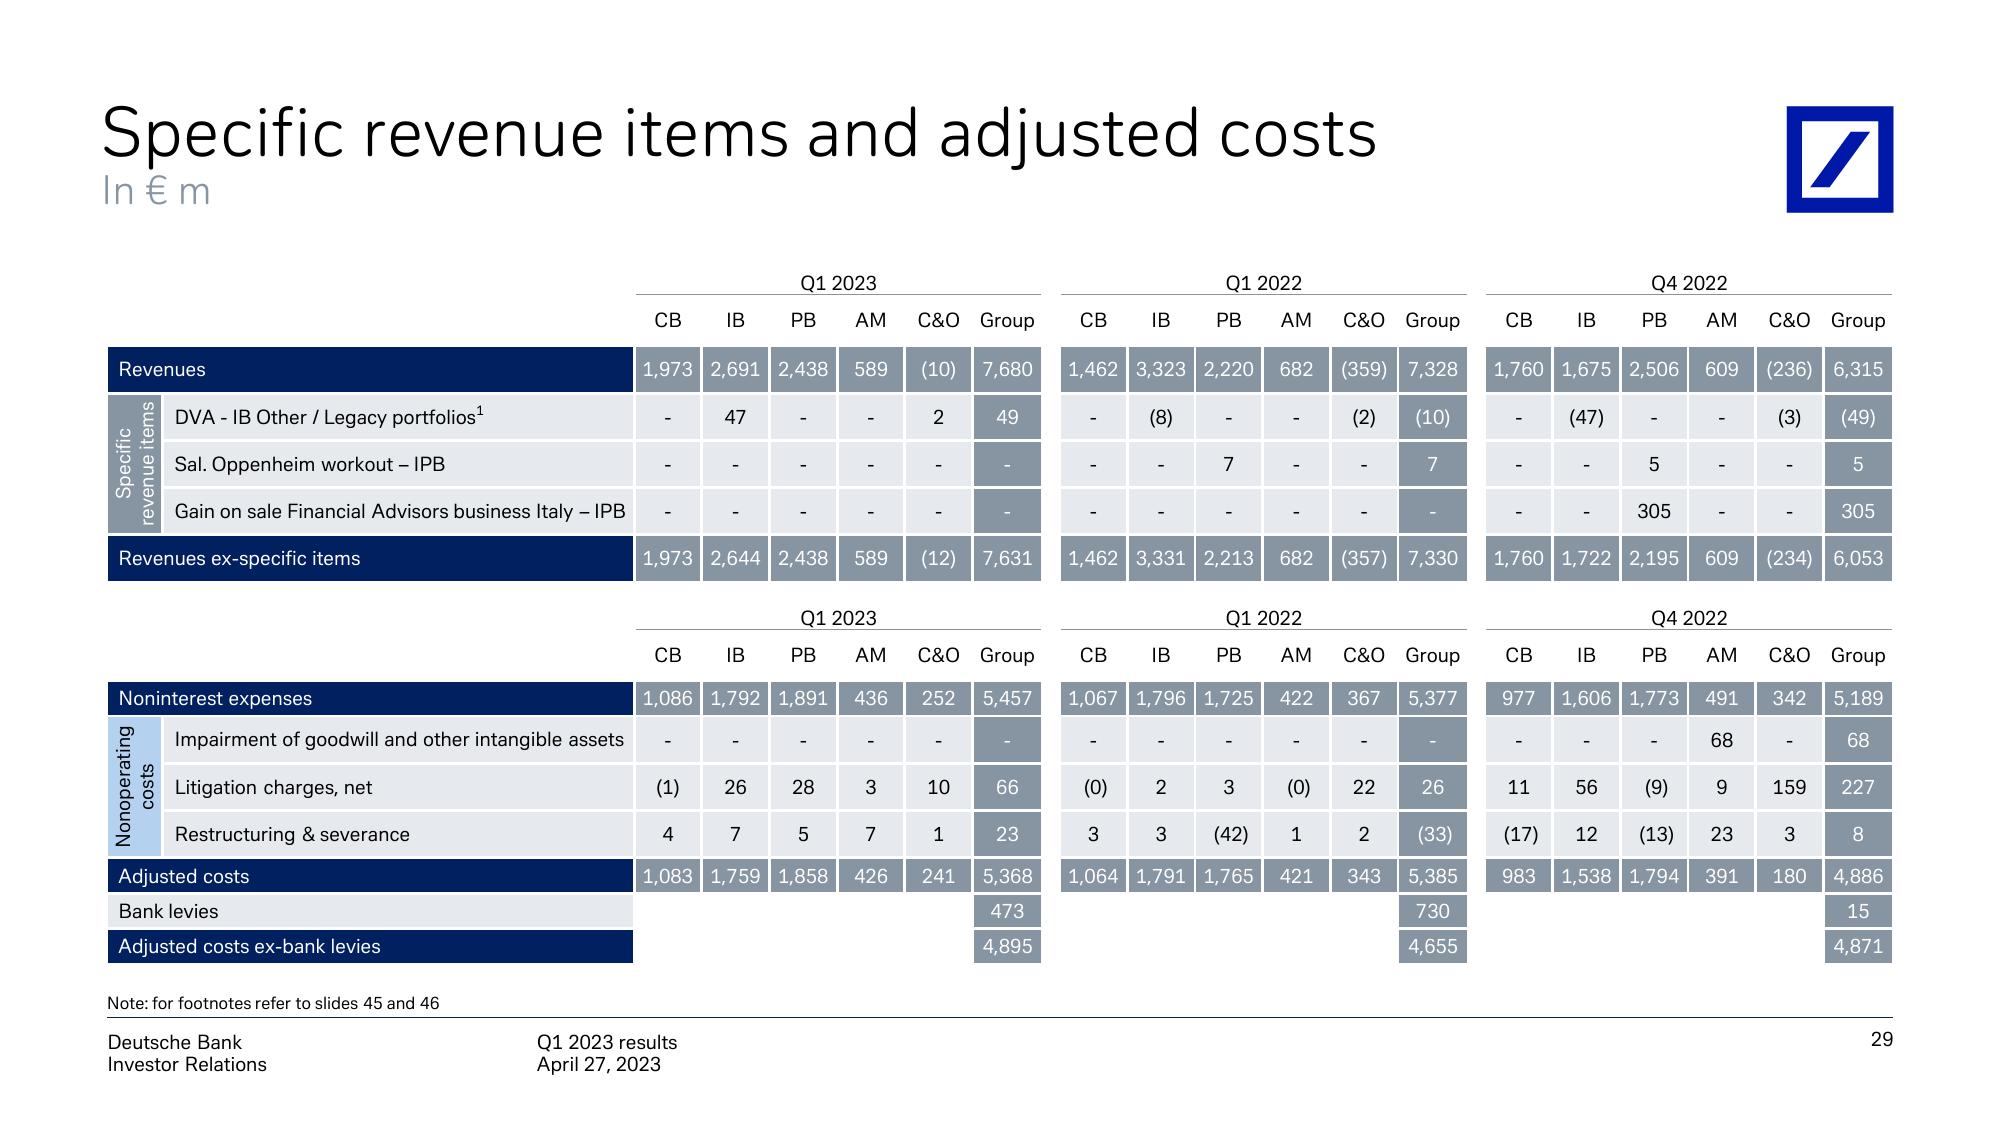
Specific revenue items and adjusted costs
In € m
Revenues
Specific
revenue items
DVA - IB Other / Legacy portfolios¹
Sal. Oppenheim workout - IPB
Gain on sale Financial Advisors business Italy - IPB
Revenues ex-specific items
Noninterest expenses
Nonoperating
costs
Impairment of goodwill and other intangible assets
Litigation charges, net
Restructuring & severance
Adjusted costs
Bank levies
Adjusted costs ex-bank levies
Note: for footnotes refer to slides 45 and 46
Deutsche Bank
Investor Relations
CB
1,973 2,691 2,438
CB
1,086
(1)
IB
4
1,083
1,973 2,644 2,438 589
Q1 2023 results
April 27, 2023
Q1 2023
PB AM C&O Group
47
589
Q1 2023
IB PB AM
1,792 1,891 436
26 28
I
3
(10)
2
(12) 7,631
10
49
C&O Group
252 5,457
7
5
7
1
1,759 1,858 426 241
7,680 1,462 3,323 2,220 682
(8)
66
CB IB
23
5,368
473
4,895
18
Q1 2022
PB AM
7
1,462 3,331 2,213
2
Q1 2022
CB IB PB AM
1,067 1,796 1,725
682
3
422
C&O Group
(359) 7,328
(2) (10)
7
(357) 7,330
(0)
(0) 22
3
3
(42)
1
2
343
1,064 1,791 1,765 421
C&O Group
367 5,377
26
(33)
5,385
730
4,655
CB
I
1,760 1,675 2,506
IB
11
Q4 2022
PB AM
(47)
(17)
983
5
1,760 1,722 2,195
305
CB IB
977 1,606 1,773
609
Q4 2022
PB AM
56 (9)
12
(13)
1,538 1,794
609
491
68
9
23
391
/
C&O Group
(236) 6,315
(3) (49)
(234) 6,053
159
3
5
C&O Group
342 5,189
68
305
180
227
8
4,886
15
4,871
29View entire presentation