Oaktree Real Estate Opportunities Fund VII, L.P.
OAKTREE REAL ESTATE OPPORTUNITIES FUND VII, L.P.
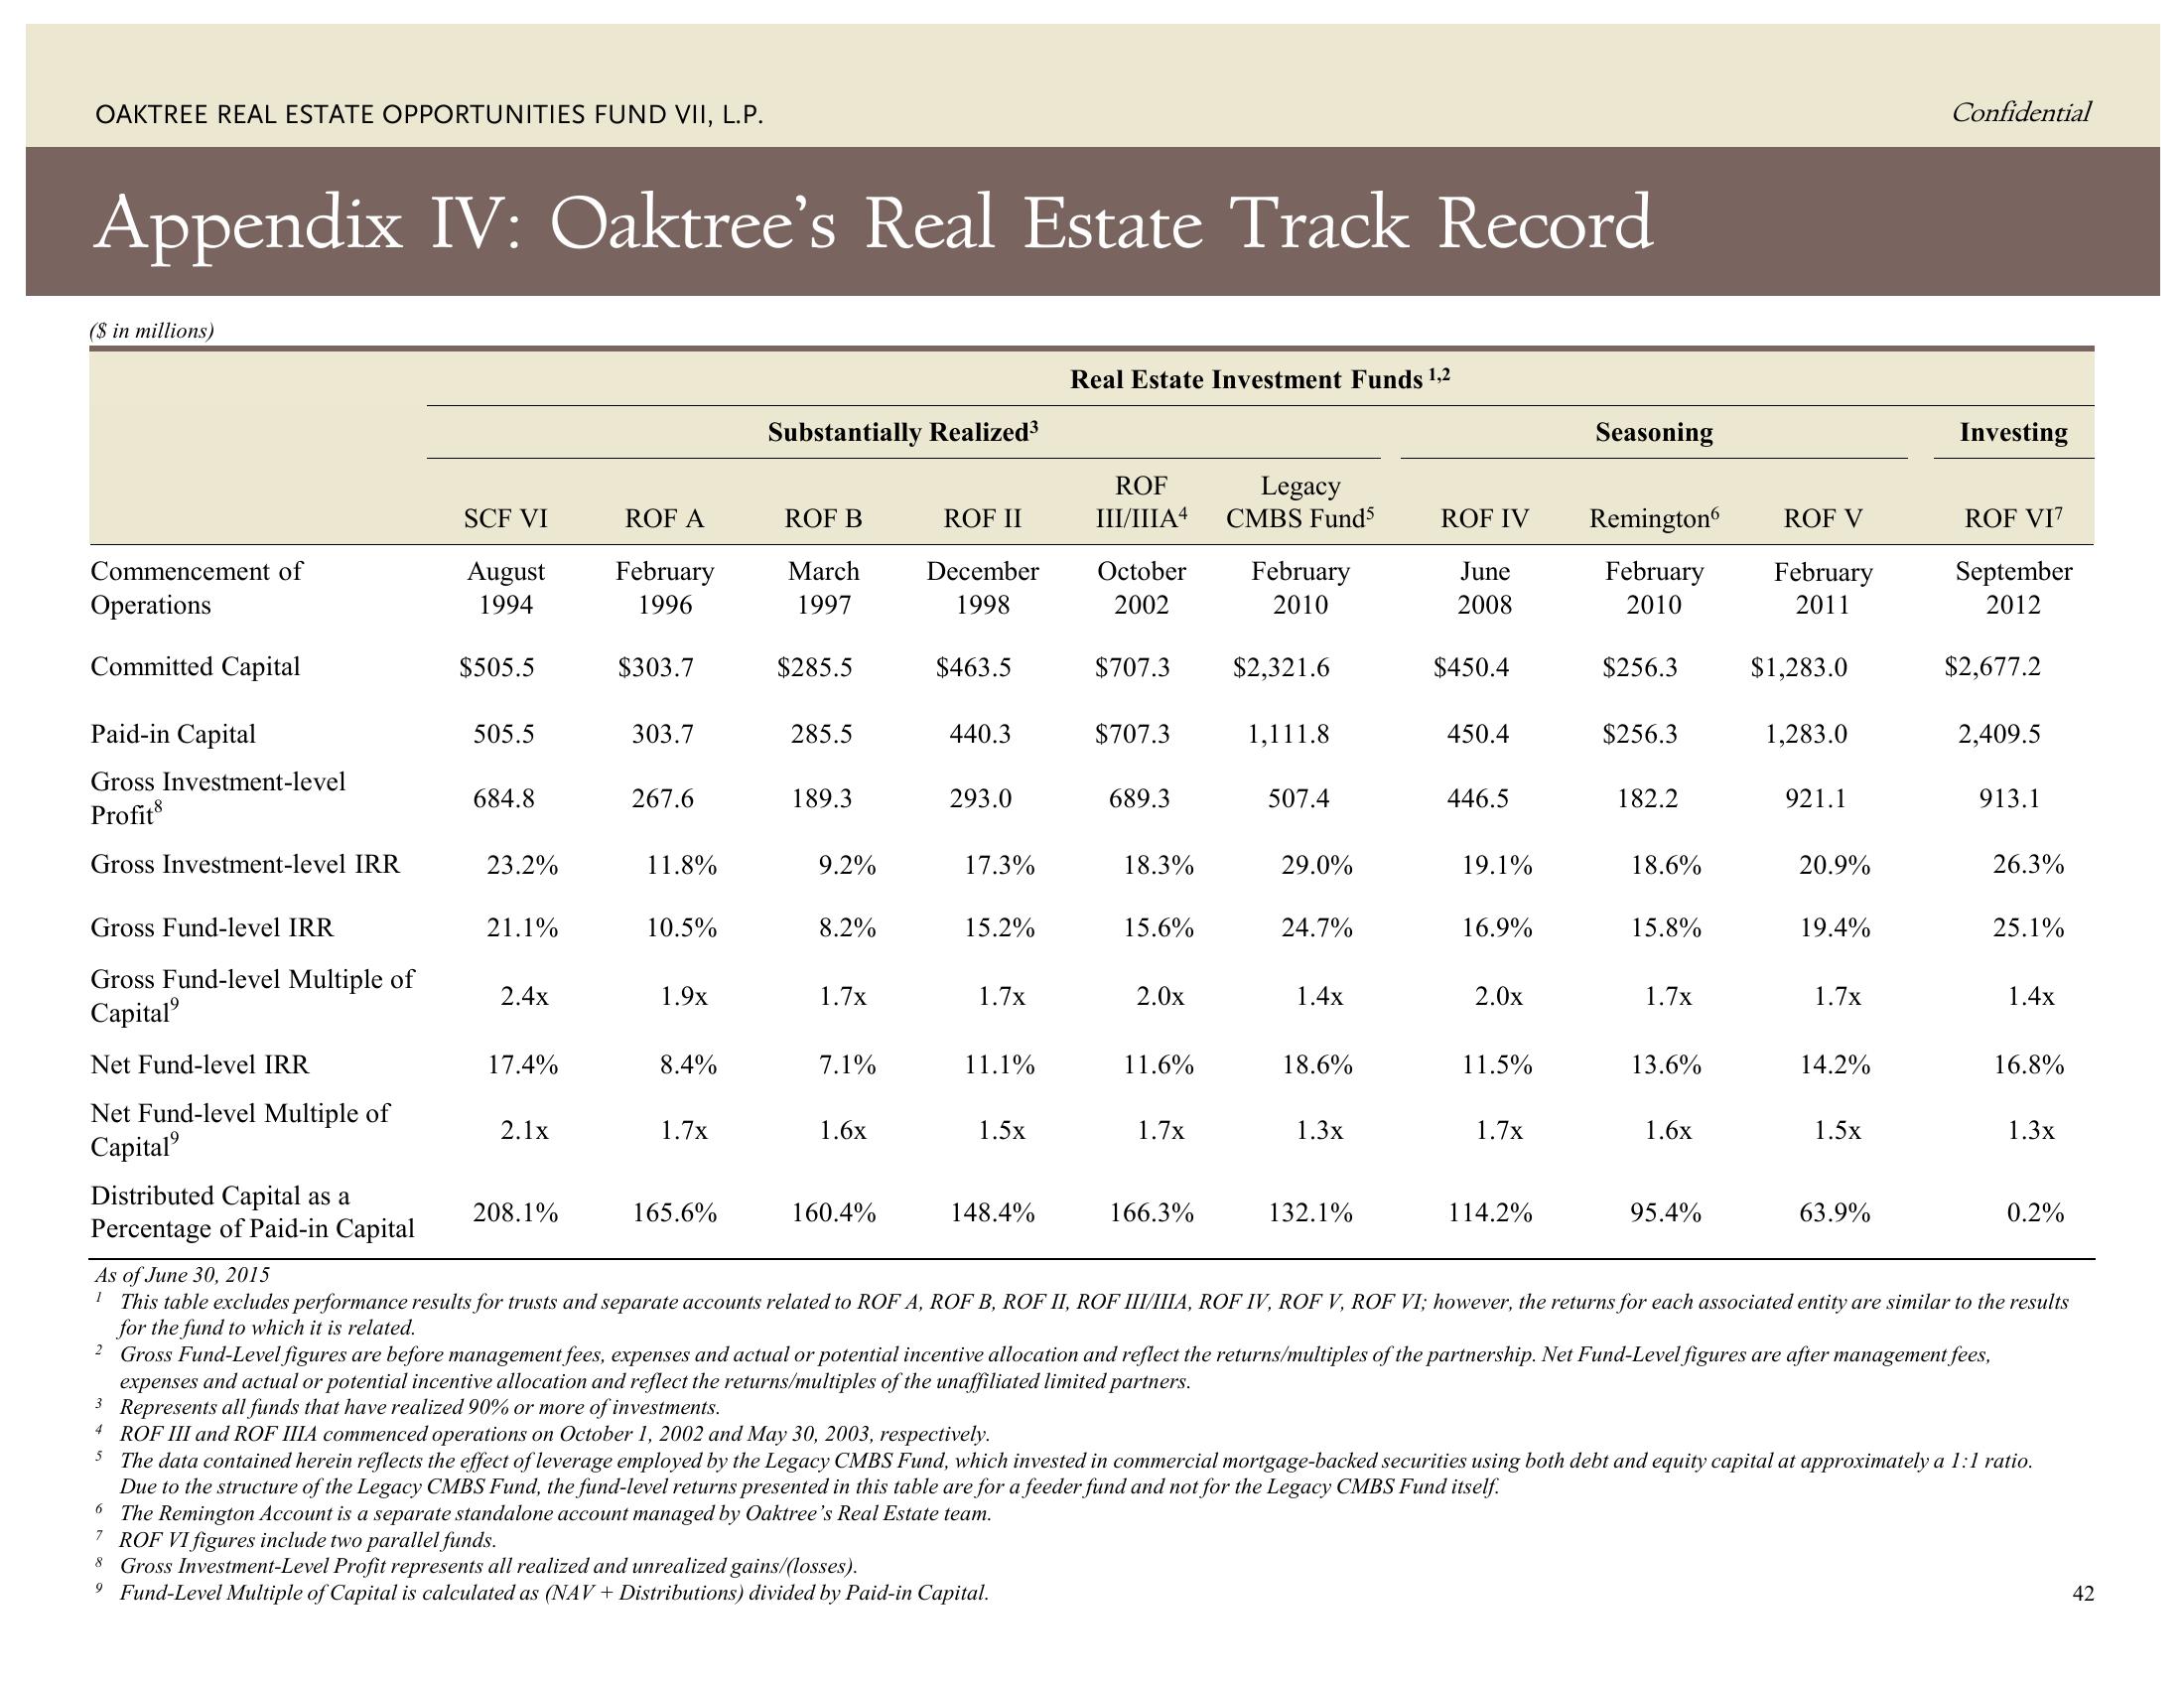
Appendix IV: Oaktree's Real Estate Track Record
($ in millions)
Commencement of
Operations
Committed Capital
Paid-in Capital
Gross Investment-level
Profit
Gross Investment-level IRR
Gross Fund-level IRR
Gross Fund-level Multiple of
Capital
Net Fund-level IRR
Net Fund-level Multiple of
Capital
Distributed Capital as a
Percentage of Paid-in Capital
SCF VI
August
1994
$505.5
505.5
684.8
23.2%
21.1%
2.4x
17.4%
2.1x
208.1%
ROF A
February
1996
$303.7
303.7
267.6
11.8%
10.5%
1.9x
8.4%
1.7x
165.6%
Substantially Realized³
ROF B
March
1997
$285.5
285.5
189.3
9.2%
8.2%
1.7x
7.1%
1.6x
160.4%
ROF II
December
1998
$463.5
440.3
293.0
17.3%
15.2%
1.7x
11.1%
1.5x
148.4%
Real Estate Investment Funds ¹,2
ROF
III/IIIA 4
October
2002
6 The Remington Account is a separate standalone account managed by Oaktree's Real Estate team.
7 ROF VI figures include two parallel funds.
$707.3
8 Gross Investment-Level Profit represents all realized and unrealized gains/(losses).
9 Fund-Level Multiple of Capital is calculated as (NAV+ Distributions) divided by Paid-in Capital.
$707.3
689.3
18.3%
15.6%
2.0x
11.6%
1.7x
166.3%
Legacy
CMBS Fund5
February
2010
$2,321.6
1,111.8
507.4
29.0%
24.7%
1.4x
18.6%
1.3x
132.1%
ROF IV
June
2008
$450.4
450.4
446.5
19.1%
16.9%
2.0x
11.5%
1.7x
114.2%
Seasoning
ROF V
Remington
February February
2010
2011
$256.3
$256.3
182.2
18.6%
15.8%
1.7x
13.6%
1.6x
95.4%
$1,283.0
1,283.0
921.1
20.9%
19.4%
1.7x
14.2%
1.5x
63.9%
Confidential
Investing
ROF VI7
September
2012
$2,677.2
2,409.5
913.1
2 Gross Fund-Level figures are before management fees, expenses and actual or potential incentive allocation and reflect the returns/multiples of the partnership. Net Fund-Level figures are after management fees,
expenses and actual or potential incentive allocation and reflect the returns/multiples of the unaffiliated limited partners.
3 Represents all funds that have realized 90% or more of investments.
4
26.3%
25.1%
1.4x
16.8%
As of June 30, 2015
1 This table excludes performance results for trusts and separate accounts related to ROF A, ROF B, ROF II, ROF III/IIIA, ROF IV, ROF V, ROF VI; however, the returns for each associated entity are similar to the results
for the fund to which it is related.
1.3x
0.2%
ROF III and ROF IIIA commenced operations on October 1, 2002 and May 30, 2003, respectively.
5 The data contained herein reflects the effect of leverage employed by the Legacy CMBS Fund, which invested in commercial mortgage-backed securities using both debt and equity capital at approximately a 1:1 ratio.
Due to the structure of the Legacy CMBS Fund, the fund-level returns presented in this table are for a feeder fund and not for the Legacy CMBS Fund itself.
42View entire presentation