Bank of America Investment Banking Pitch Book
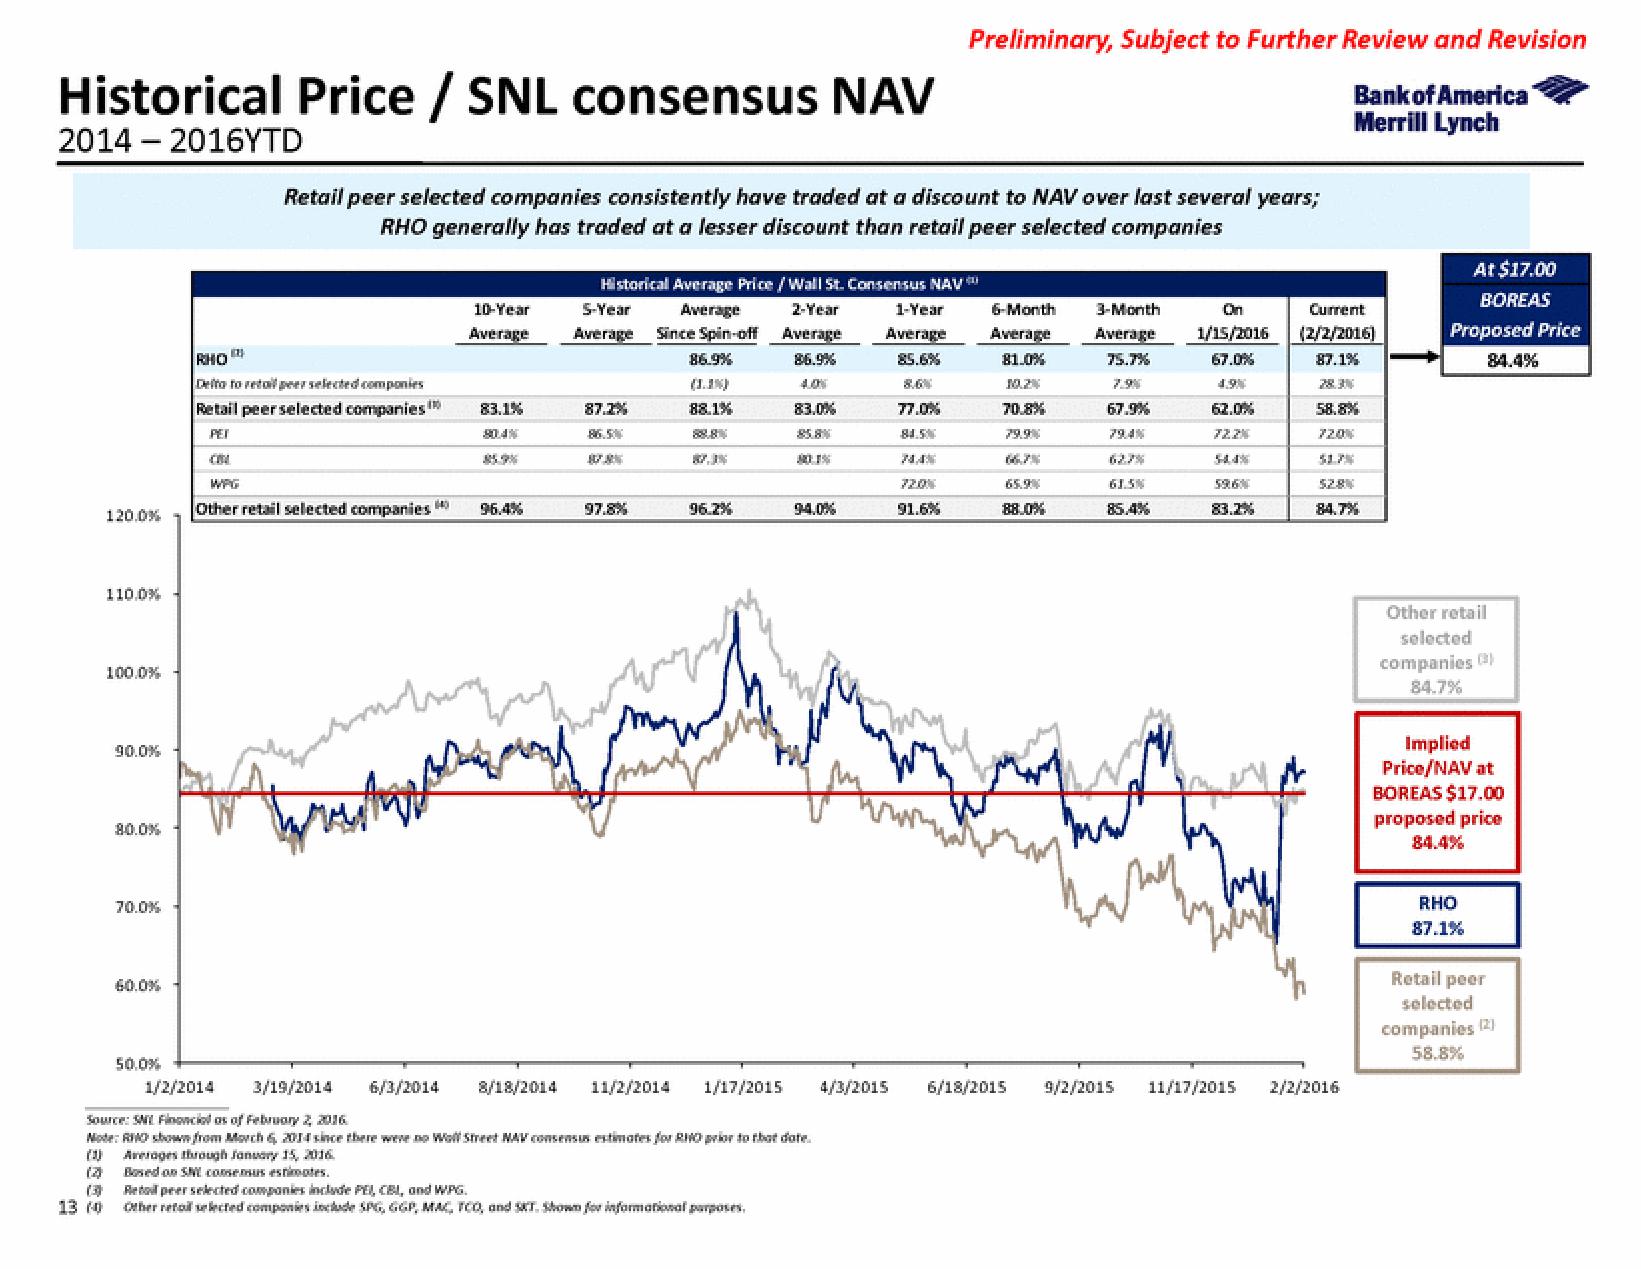
Historical Price / SNL consensus NAV
2014 - 2016YTD
120.0%
110.0%
100.0%
90.0%
80.0%
70.0%
50.0%
123
Retail peer selected companies consistently have traded at a discount to NAV over last several years;
RHO generally has traded at a lesser discount than retail peer selected companies
RHO
Delto to retail peer selected companies
Retail peer selected companies
PET
WPG
Other retail selected companies
6/3/2014
10-Year
Average
83.1%
96.4%
Historical Average Price/Wall St. Consensus NAV
Average 2-Year
Since Spin-off Average
86.9%
4.01
83.0%
8/18/2014
5-Year
Average
87.2%
97.8%
(1.1%)
88.1%
11/2/2014
96.2%
1/2/2014
3/19/2014
Source: SML Finoncial as of February 2 2016
Note: RO shown from Morch 6, 2014 since there were no Woll Street NAV consensus estimates for RHO prior to that date.
10 Averages through January 15, 2016.
(3
Bosed on SM consemus estimates.
(3)
13 (0
94.0%
1/17/2015 4/3/2015
Repeer selected companies include PEI, CBI, and WPG.
Other retail selected companies include SPG, GGP, MAC, TCO, and ST. Shown for informational purposes.
1-Year
Average
85.6%
77.0%
81.5%
Preliminary, Subject to Further Review and Revision
Bank of America
Merrill Lynch
91.6%
6-Month
Average
81.0%
10.2%
70.8%
65.9%
88.0%
6/18/2015
3-Month
Average
75.7%
7.9%
67.9%
61.5%
85.4%
mat
On
1/15/2016
67.0%
4.9%
62.0%
596%
83.2%
Weny
9/2/2015 11/17/2015
Current
(2/2/2016)
87.1%
58.8%
84.7%
2/2/2016
At $17.00
BOREAS
Proposed Price
Other retail
selected
companies (3)
84.7%
Implied
Price/NAV at
BOREAS $17.00
proposed price
RHO
87.1%
Retail peer
selected
companies (2)
58.8%View entire presentation