Oatly Results Presentation Deck
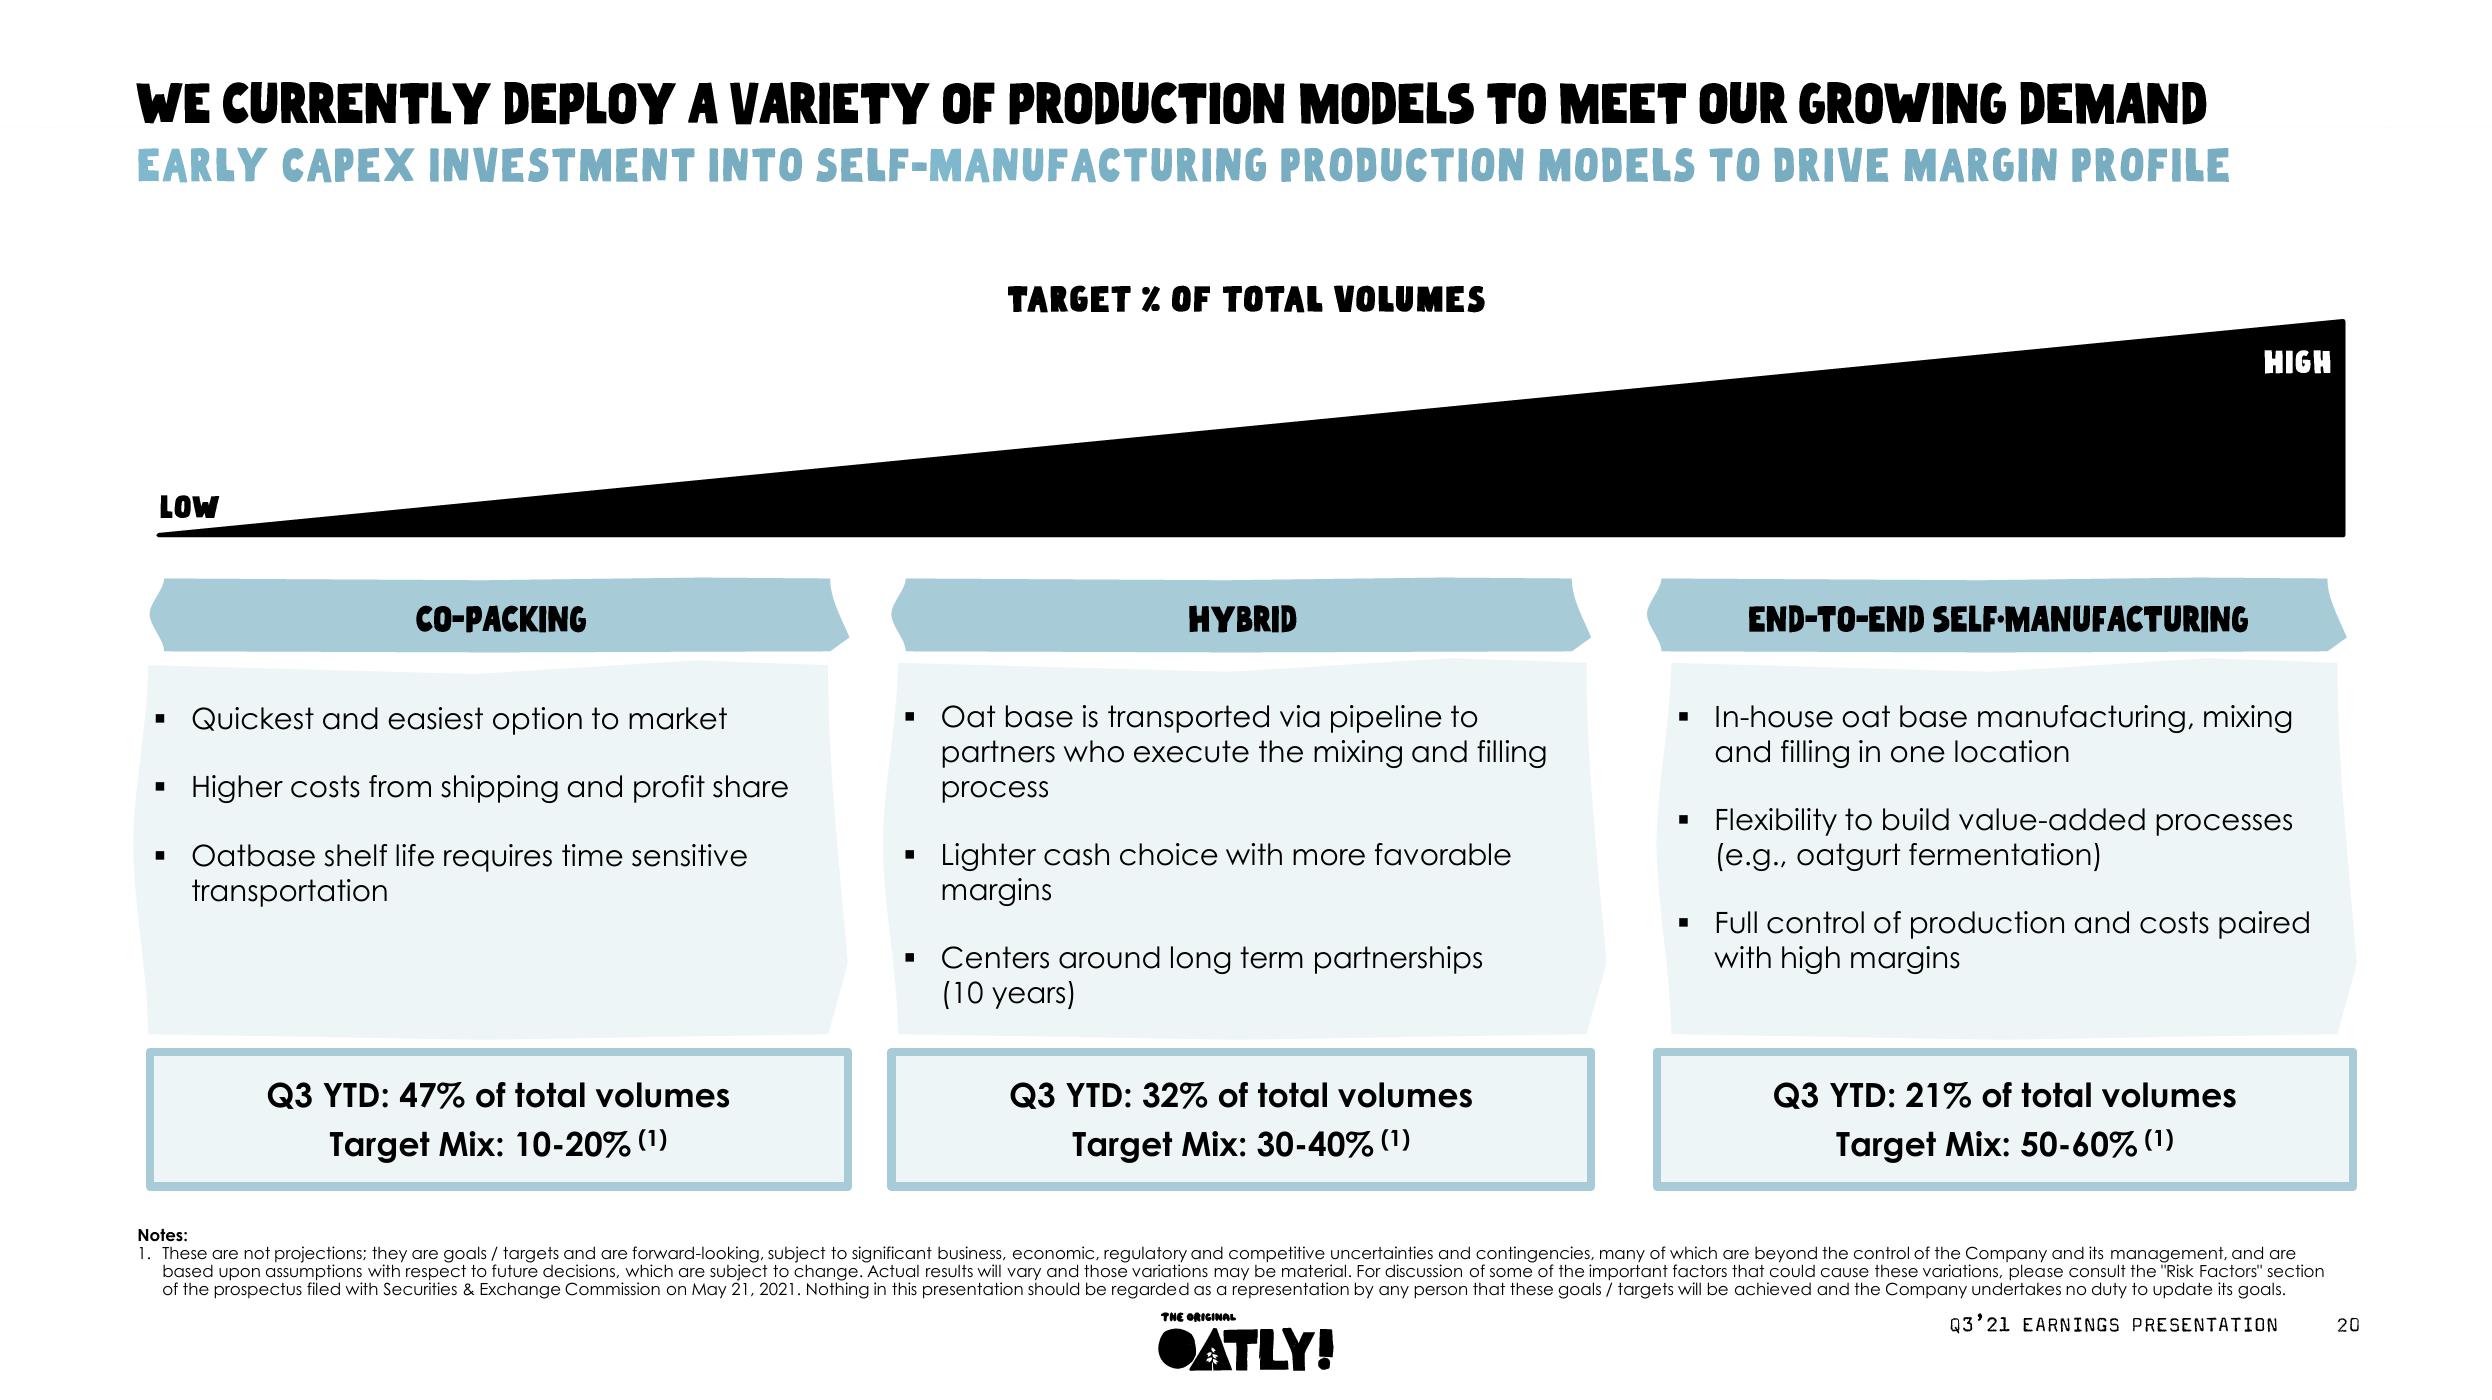
WE CURRENTLY DEPLOY A VARIETY OF PRODUCTION MODELS TO MEET OUR GROWING DEMAND
EARLY CAPEX INVESTMENT INTO SELF-MANUFACTURING PRODUCTION MODELS TO DRIVE MARGIN PROFILE
LOW
CO-PACKING
■
Quickest and easiest option to market
Higher costs from shipping and profit share
▪ Oatbase shelf life requires time sensitive
transportation
Q3 YTD: 47% of total volumes
Target Mix: 10-20% (¹)
■
■
TARGET % OF TOTAL VOLUMES
HYBRID
Oat base is transported via pipeline to
partners who execute the mixing and filling
process
Lighter cash choice with more favorable
margins
▪ Centers around long term partnerships
(10 years)
Q3 YTD: 32% of total volumes
Target Mix: 30-40% (¹)
■
●ATLY!
■
END-TO-END SELF-MANUFACTURING
HIGH
In-house oat base manufacturing, mixing
and filling in one location
Flexibility to build value-added processes
(e.g., oatgurt fermentation)
Full control of production and costs paired
with high margins
Q3 YTD: 21% of total volumes
Target Mix: 50-60% (¹)
Notes:
1. These are not projections; they are goals/ targets and are forward-looking, subject to significant business, economic, regulatory and competitive uncertainties and contingencies, many of which are beyond the control of the Company and its management, and are
based upon assumptions with respect to future decisions, which are subject to change. Actual results will vary and those variations may be material. For discussion of some of the important factors that could cause these variations, please consult the "Risk Factors" section
of the prospectus filed with Securities & Exchange Commission on May 21, 2021. Nothing in this presentation should be regarded as a representation by any person that these goals/ targets will be achieved and the Company undertakes no duty to update its goals.
Q3'21 EARNINGS PRESENTATION
THE ORIGINAL
20View entire presentation