Matterport Results Presentation Deck
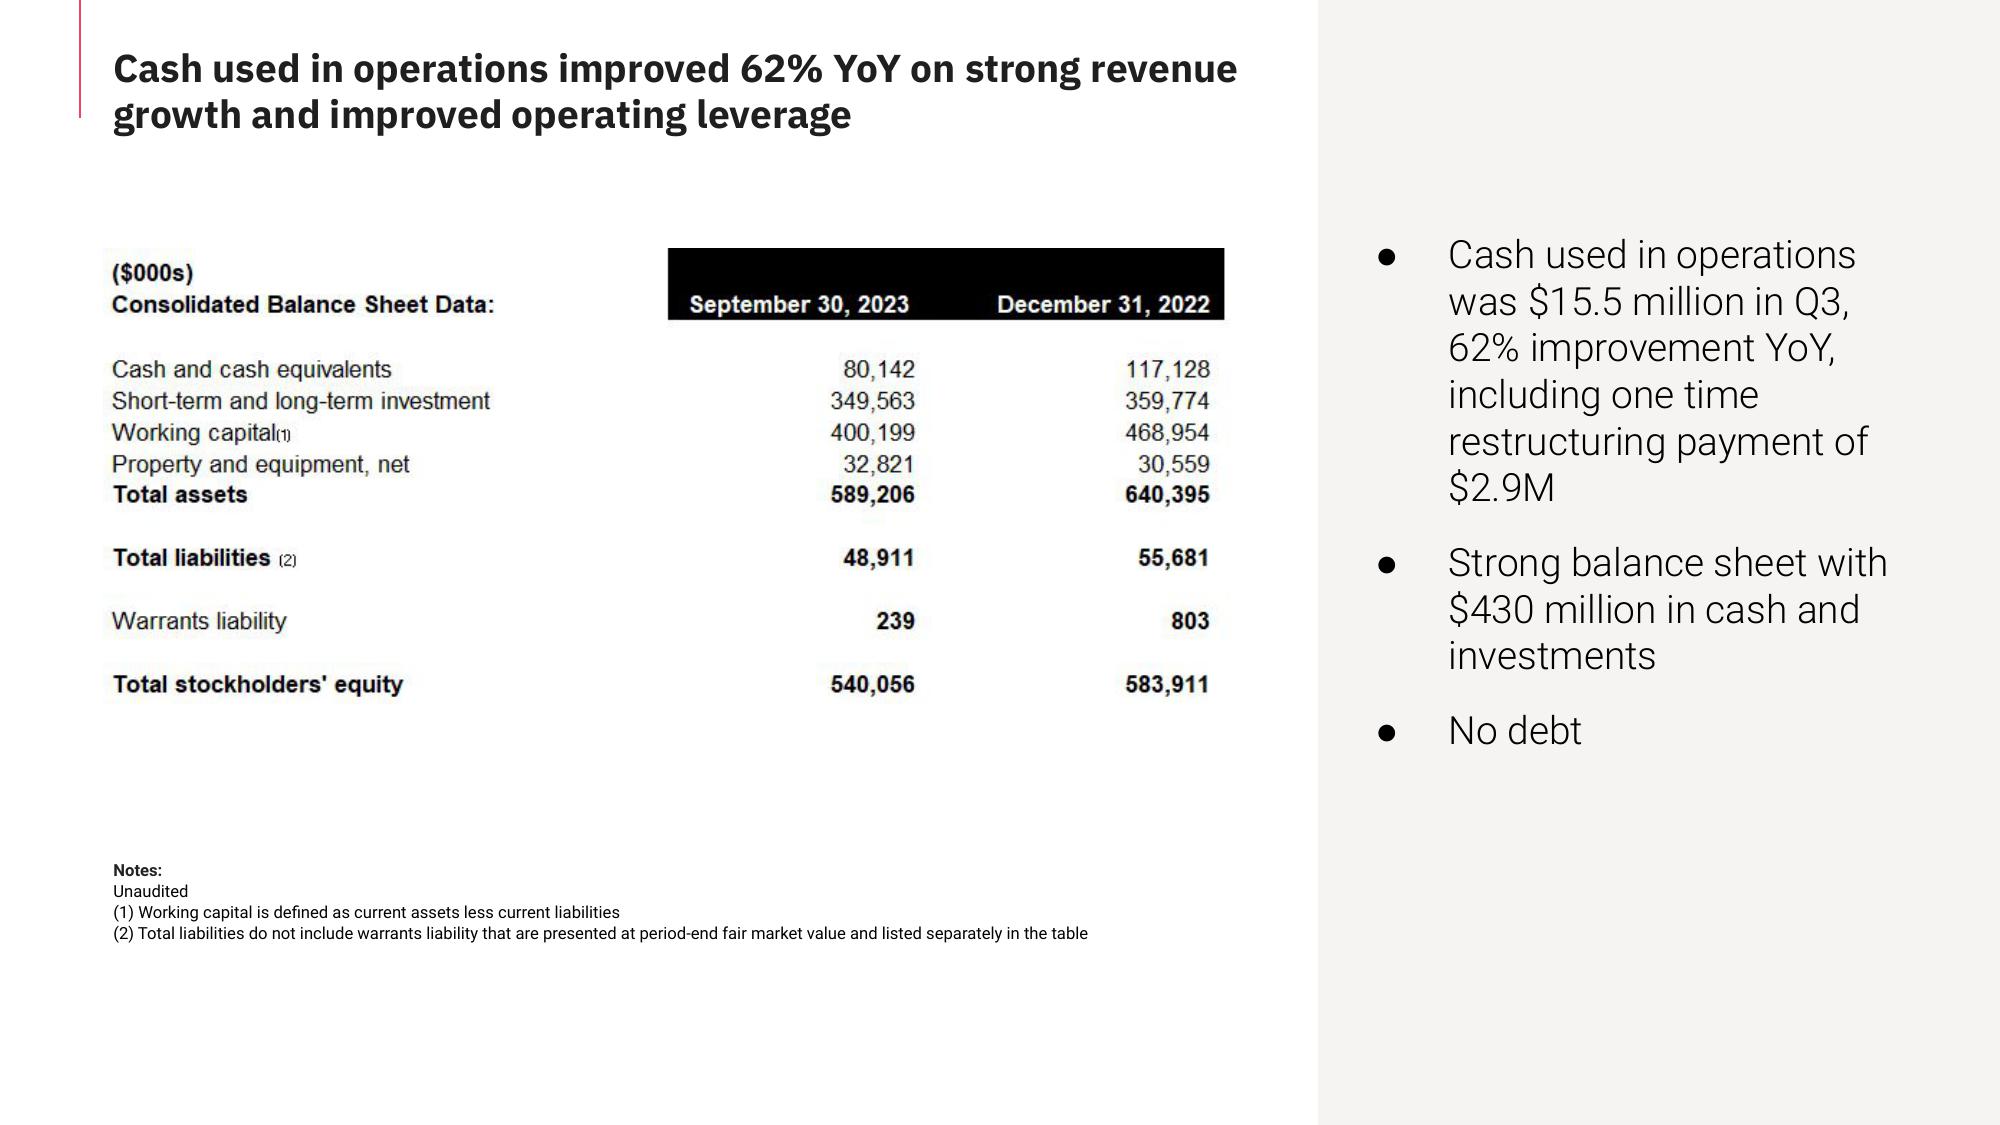
Cash used in operations improved 62% YoY on strong revenue
growth and improved operating leverage
($000s)
Consolidated Balance Sheet Data:
Cash and cash equivalents
Short-term and long-term investment
Working capital (1)
Property and equipment, net
Total assets
Total liabilities (2)
Warrants liability
Total stockholders' equity
Notes:
Unaudited
September 30, 2023
80,142
349,563
400, 199
32,821
589,206
48,911
239
540,056
December 31, 2022
(1) Working capital is defined as current assets less current liabilities
(2) Total liabilities do not include warrants liability that are presented at period-end fair market value and listed separately in the table
117,128
359,774
468,954
30,559
640,395
55,681
803
583,911
Cash used in operations
was $15.5 million in Q3,
62% improvement YoY,
including one time
restructuring payment of
$2.9M
Strong balance sheet with
$430 million in cash and
investments
No debtView entire presentation