Overstock Results Presentation Deck
20%
18%
16%
14%
12%
10%
8%
6%
4%
2%
0%
Oct-16
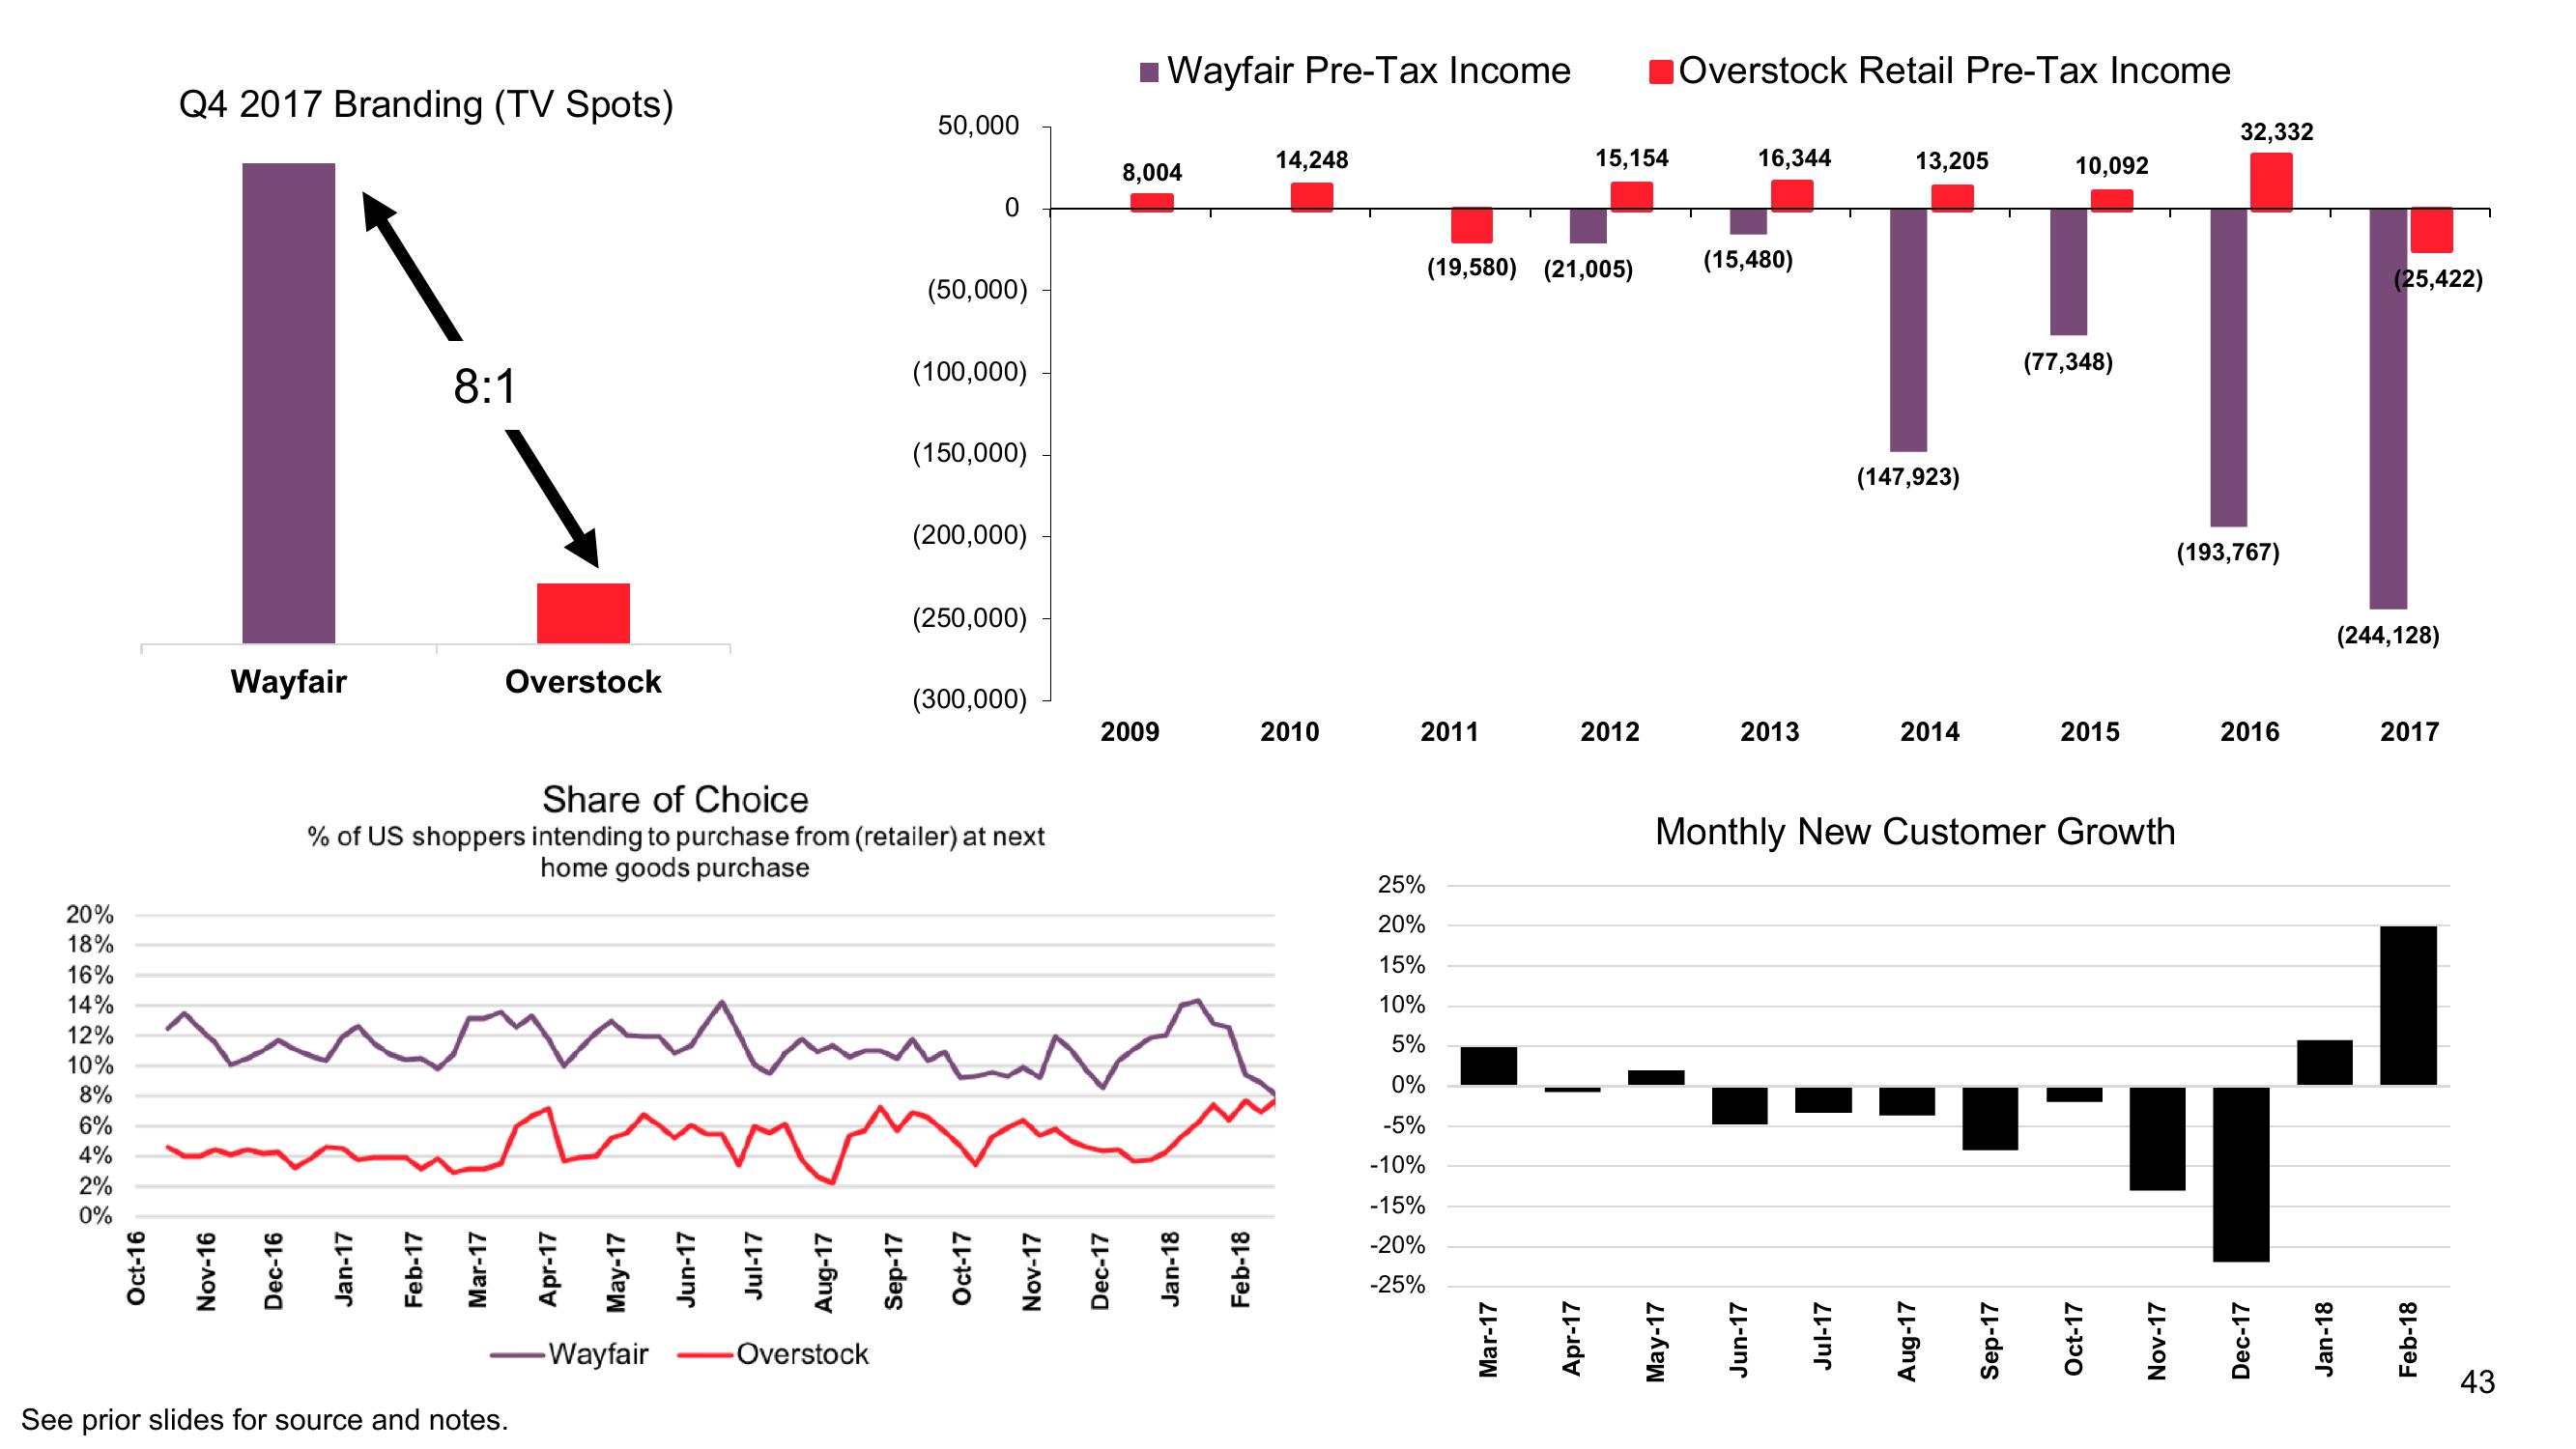
Q4 2017 Branding (TV Spots)
Nov-16
Wayfair
~
Dec-16
Jan-17
8:1
Feb-17
Overstock
Mar-17
See prior slides for source and notes.
m
Share of Choice
% of US shoppers intending to purchase from (retailer) at next
home goods purchase
Apr-17
May-17
-Wayfair
Jun-17
Jul-17
v
Aug-17
Sep-17
50,000
-Overstock
(50,000)
(100,000)
(150,000)
(200,000)
(250,000)
(300,000)
Oct-17
Nov-17
■Wayfair Pre-Tax Income
Dec-17
8,004
2009
Jan-18
Feb-18
14,248
2010
2011
25%
20%
15%
10%
5%
0%
-5%
-10%
-15%
-20%
-25%
(19,580) (21,005)
Mar-17
15,154
2012
Apr-17
Overstock Retail Pre-Tax Income
May-17
(15,480)
16,344
2013
Jun-17
10,092
(25,422)
(off
IF
(77,348)
(193,767)
T
Jul-17
13,205
(147,923)
Monthly New Customer Growth
2014
Aug-17
2015
Sep-17
32,332
Oct-17
Nov-17
2016
Y
Dec-17
(244,128)
Jan-18
2017
Feb-18
43View entire presentation