Bank of America Investment Banking Pitch Book
Opportunity
Opportunity
Opportunity
2
Opportunity
3
Opportunity
Source: Pioneer Forecast.
Note: Dollars in millions.
B
■
2
■
7
S
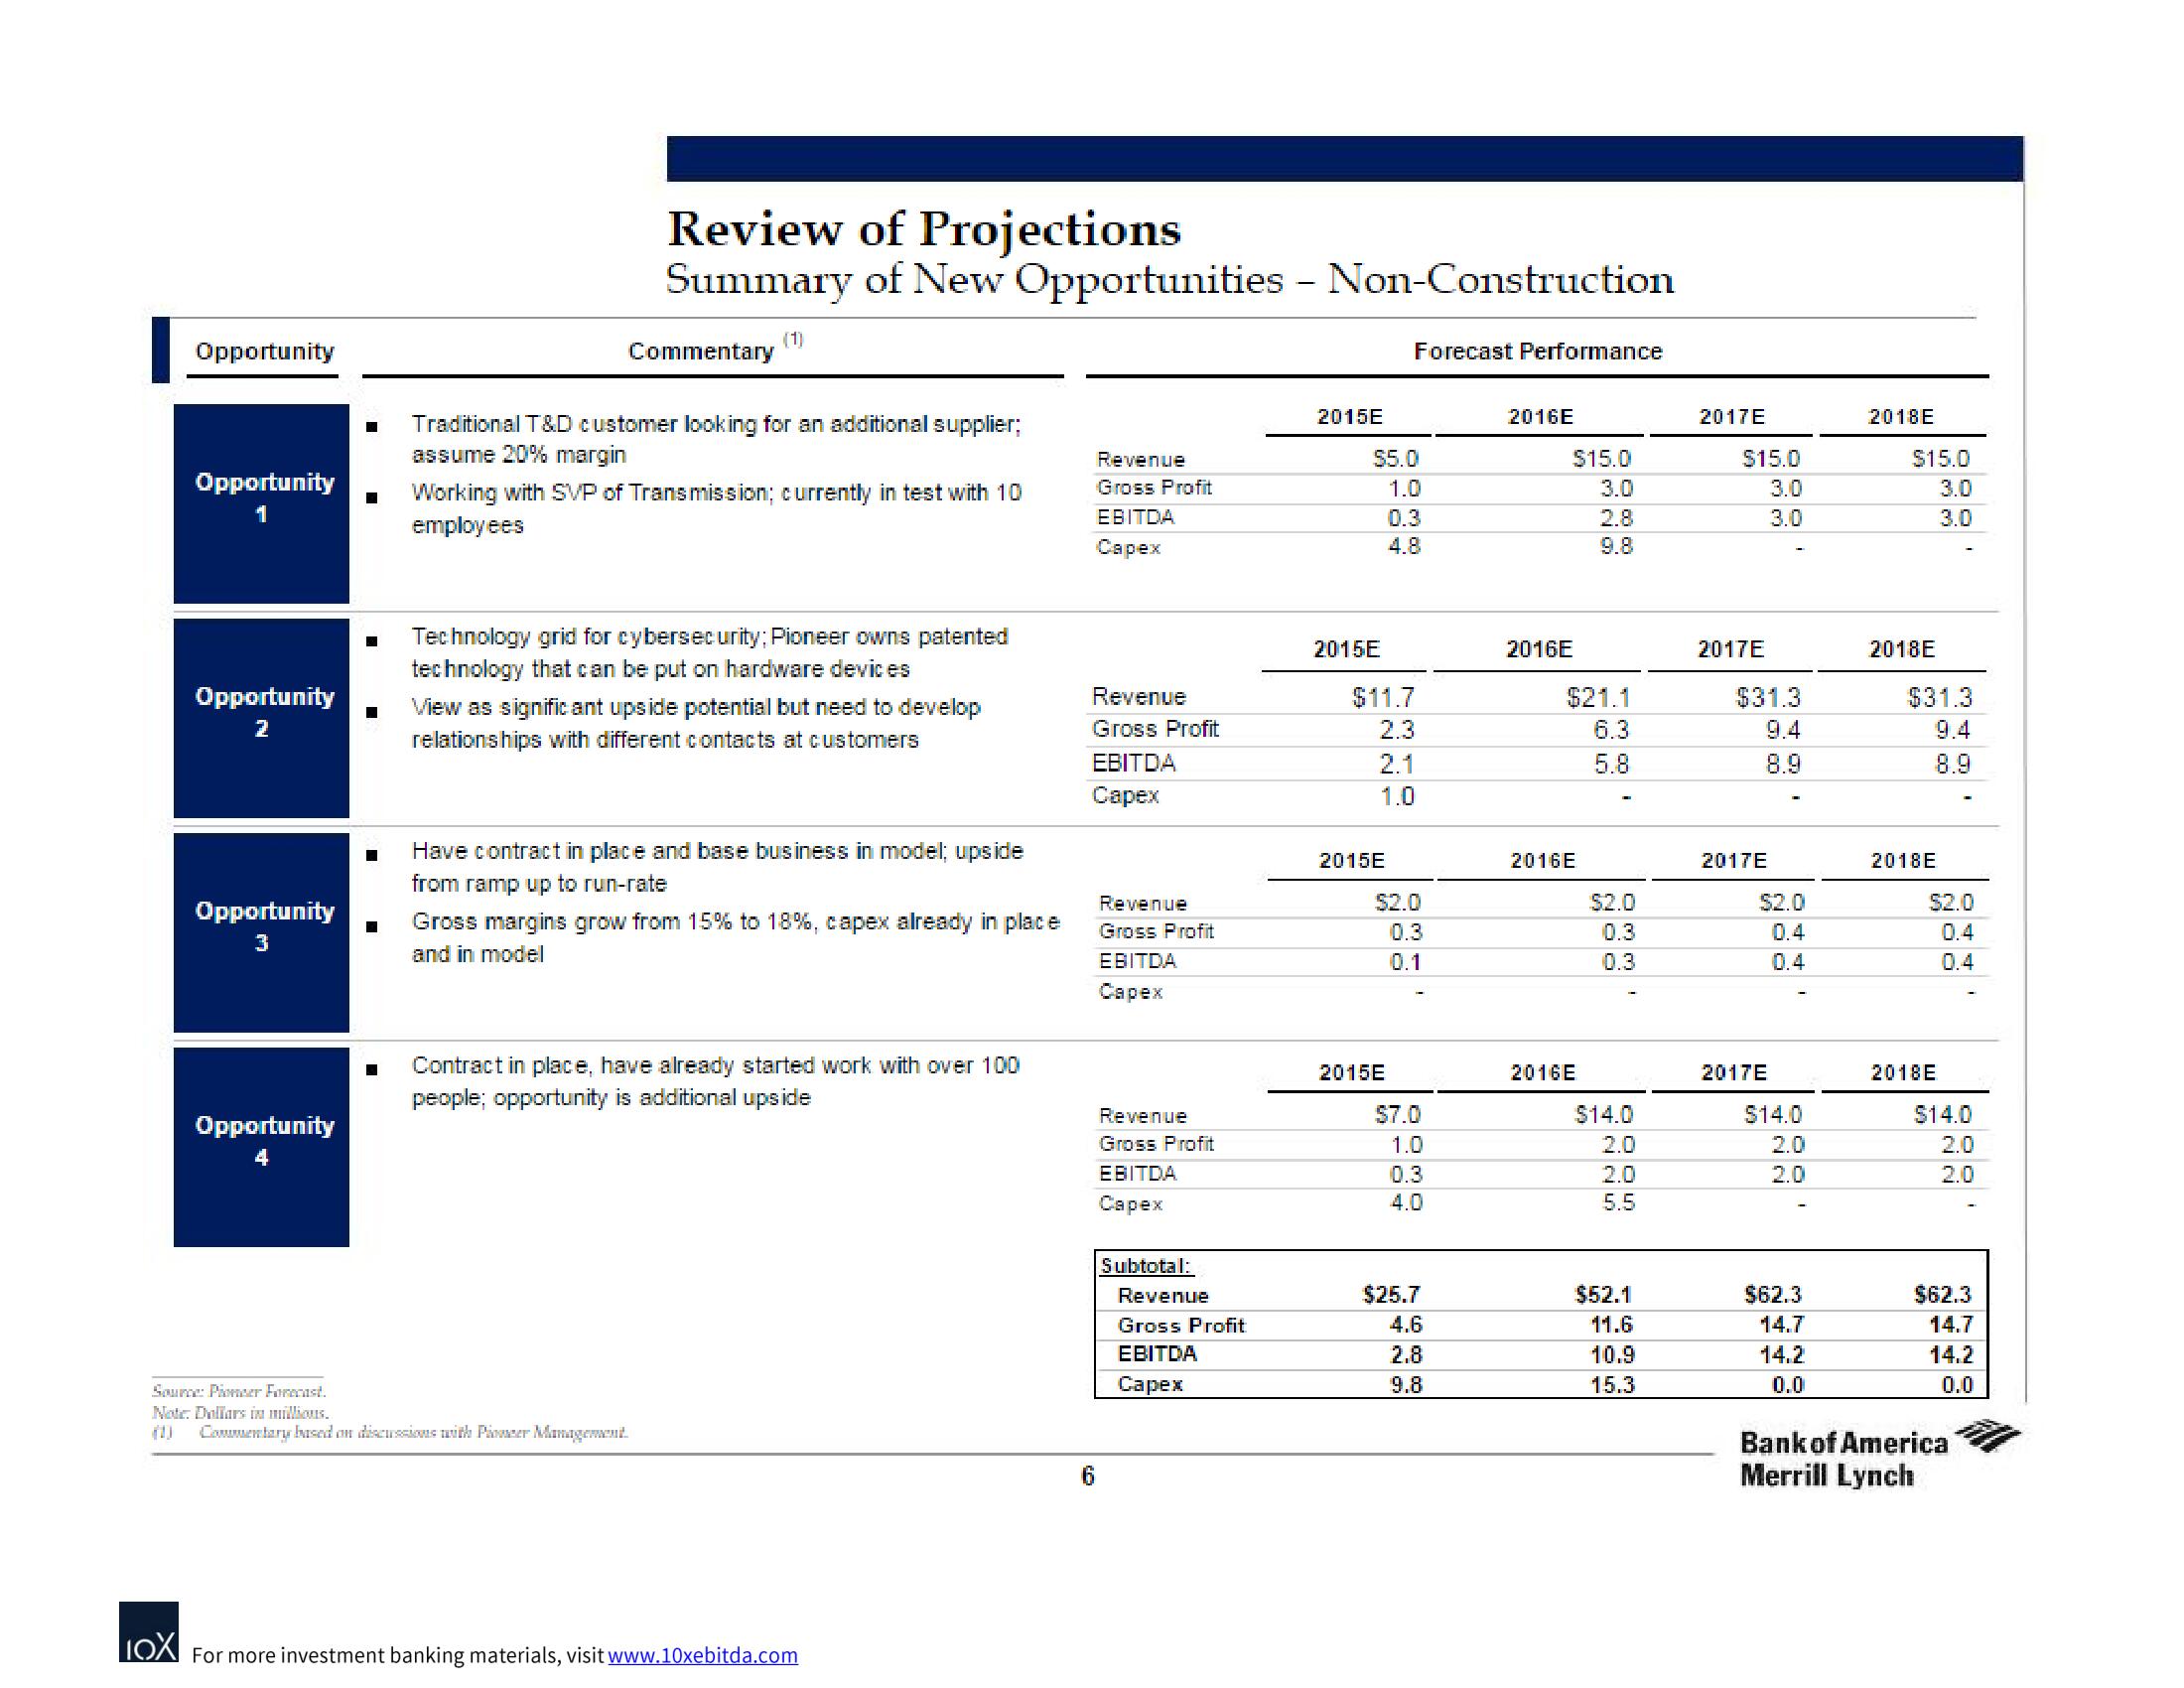
Review of Projections
Summary of New Opportunities - Non-Construction
Commentary
(1)
Traditional T&D customer looking for an additional supplier;
assume 20% margin
Working with SVP of Transmission; currently in test with 10
employees
Technology grid for cybersecurity; Pioneer owns patented
technology that can be put on hardware devices
View as significant upside potential but need to develop
relationships with different contacts at customers
Have contract in place and base business in model; upside
from ramp up to run-rate
Gross margins grow from 15% to 18%, capex already in place
and in model
Commentary based on discussions with Pioneer Management.
Contract in place, have already started work with over 100
people; opportunity is additional upside
LOX For more investment banking materials, visit www.10xebitda.com
Revenue
Gross Profit
EBITDA
Capex
Revenue
Gross Profit
EBITDA
Capex
6
Revenue
Gross Profit
EBITDA
Capex
Revenue
Gross Profit
EBITDA
Capex
Subtotal:
Revenue
Gross Profit
EBITDA
Capex
2015E
$5.0
1.0
0.3
4.8
2015E
$11.7
2.3
2.1
1.0
2015E
Forecast Performance
$2.0
0.3
0.1
2015E
70-4
WO
$7.0
GOMO
1.0
0.3
4.0
$25.7
4.6
2.8
9.8
2016E
2016E
$15.0
3.0
2.8
9.8
$21.1
6.3
5.8
2016E
2016E
$2.0
0.3
0.3
0331
4225
OOO5
$14.0
2.0
2.0
5.5
$52.1
11.6
10.9
15.3
2017E
$15.0
3.0
3.0
2017E
$31.3
9.4
8.9
2017E
$2.0
0.4
0.4
2017E
$14.0
2.0
2.0
$62.3
14.7
14.2
0.0
2018E
$15.0
3.0
2018E
2018E
$31.3
9.4
8.9
OO
3.0
2018E
$2.0
0.4
0.4
I
$14.0
2.0
2.0
Bank of America
Merrill Lynch
$62.3
14.7
14.2
0.0View entire presentation