IGI SPAC Presentation Deck
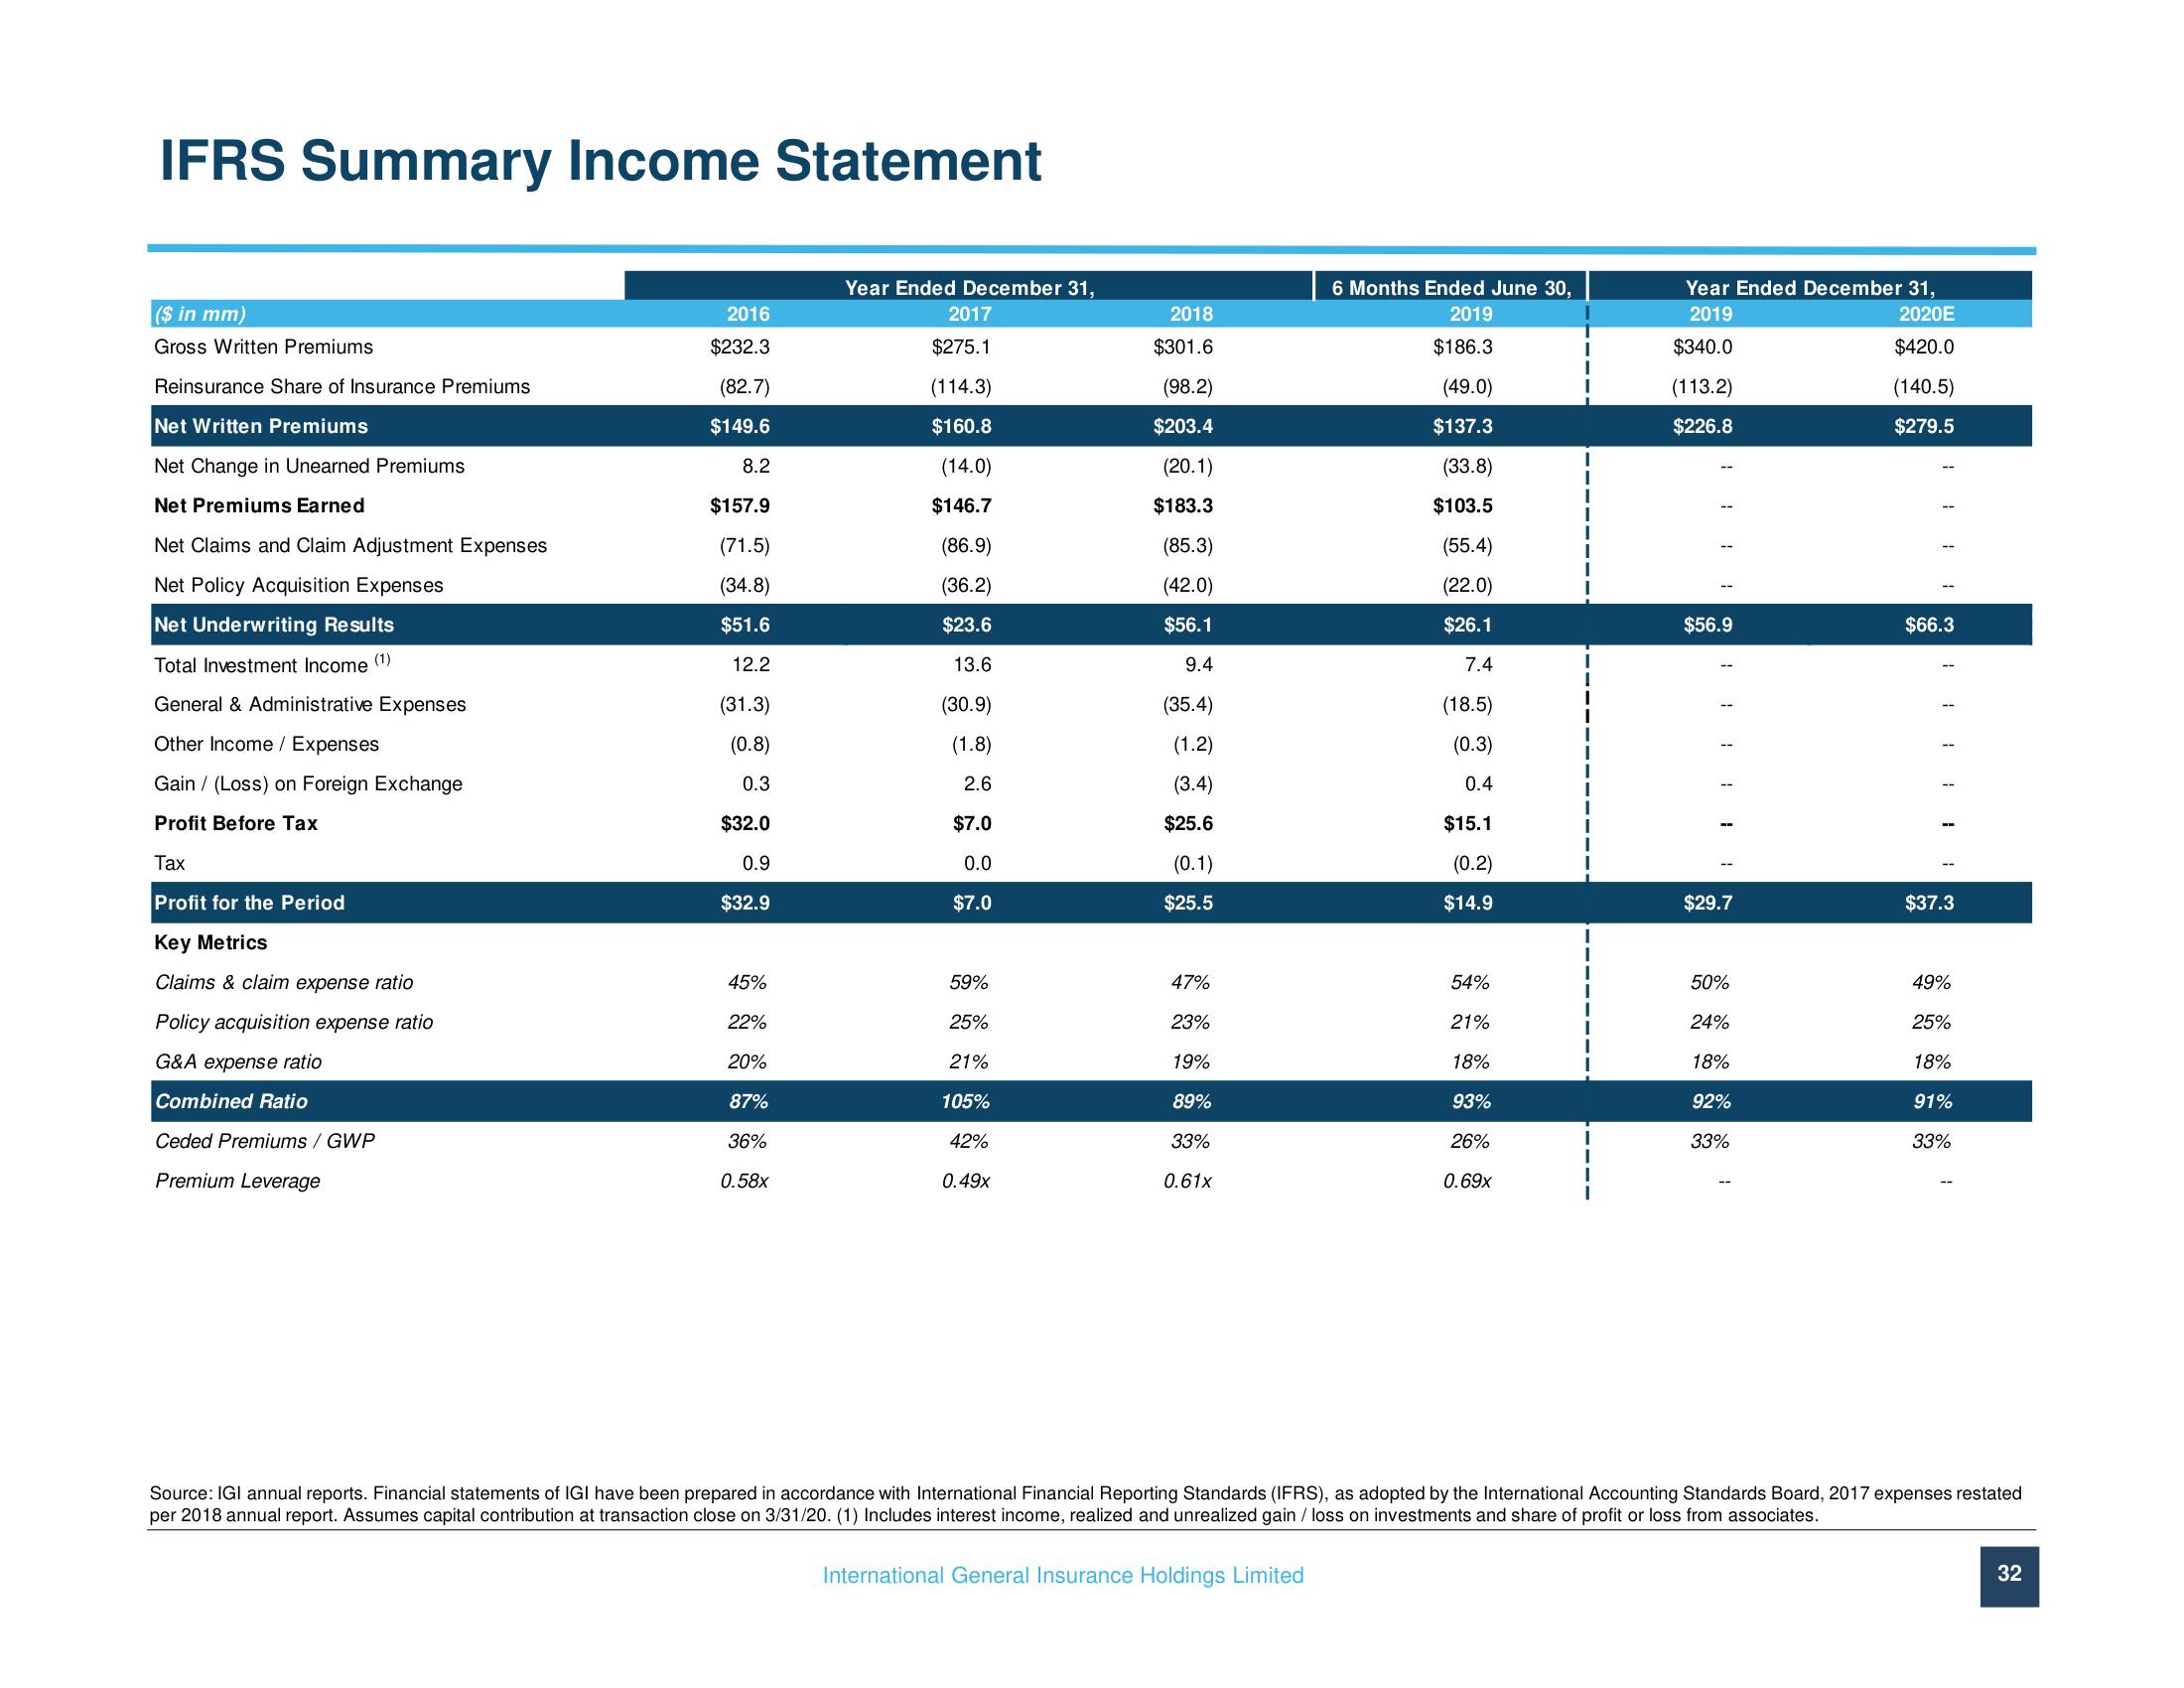
IFRS Summary Income Statement
($ in mm)
Gross Written Premiums
Reinsurance Share of Insurance Premiums
Net Written Premiums
Net Change in Unearned Premiums
Net Premiums Earned
Net Claims and Claim Adjustment Expenses
Net Policy Acquisition Expenses
Net Underwriting Results
Total Investment Income (1)
General & Administrative Expenses
Other Income / Expenses
Gain (Loss) on Foreign Exchange
Profit Before Tax
Tax
Profit for the Period
Key Metrics
Claims & claim expense ratio
Policy acquisition expense ratio
G&A expense ratio
Combined Ratio
Ceded Premiums / GWP
Premium Leverage
2016
$232.3
(82.7)
$149.6
8.2
$157.9
(71.5)
(34.8)
$51.6
12.2
(31.3)
(0.8)
0.3
$32.0
0.9
$32.9
45%
22%
20%
87%
36%
0.58x
Year Ended December 31,
2017
$275.1
(114.3)
$160.8
(14.0)
$146.7
(86.9)
(36.2)
$23.6
13.6
(30.9)
(1.8)
2.6
$7.0
0.0
$7.0
59%
25%
21%
105%
42%
0.49x
2018
$301.6
(98.2)
$203.4
(20.1)
$183.3
(85.3)
(42.0)
$56.1
9.4
(35.4)
(1.2)
(3.4)
$25.6
(0.1)
$25.5
47%
23%
19%
89%
33%
0.61x
6 Months Ended June 30,
2019
$186.3
(49.0)
$137.3
(33.8)
$103.5
(55.4)
(22.0)
$26.1
7.4
(18.5)
(0.3)
0.4
$15.1
(0.2)
$14.9
54%
21%
18%
93%
26%
0.69x
Year Ended December 31,
2019
2020E
$340.0
$420.0
(113.2)
$226.8
$56.9
$29.7
50%
24%
18%
92%
33%
(140.5)
$279.5
$66.3
$37.3
49%
25%
18%
91%
33%
Source: IGI annual reports. Financial statements of IGI have been prepared in accordance with International Financial Reporting Standards (IFRS), as adopted by the International Accounting Standards Board, 2017 expenses restated
per 2018 annual report. Assumes capital contribution at transaction close on 3/31/20. (1) Includes interest income, realized and unrealized gain / loss on investments and share of profit or loss from associates.
International General Insurance Holdings Limited
32View entire presentation