Masterworks Investor Update
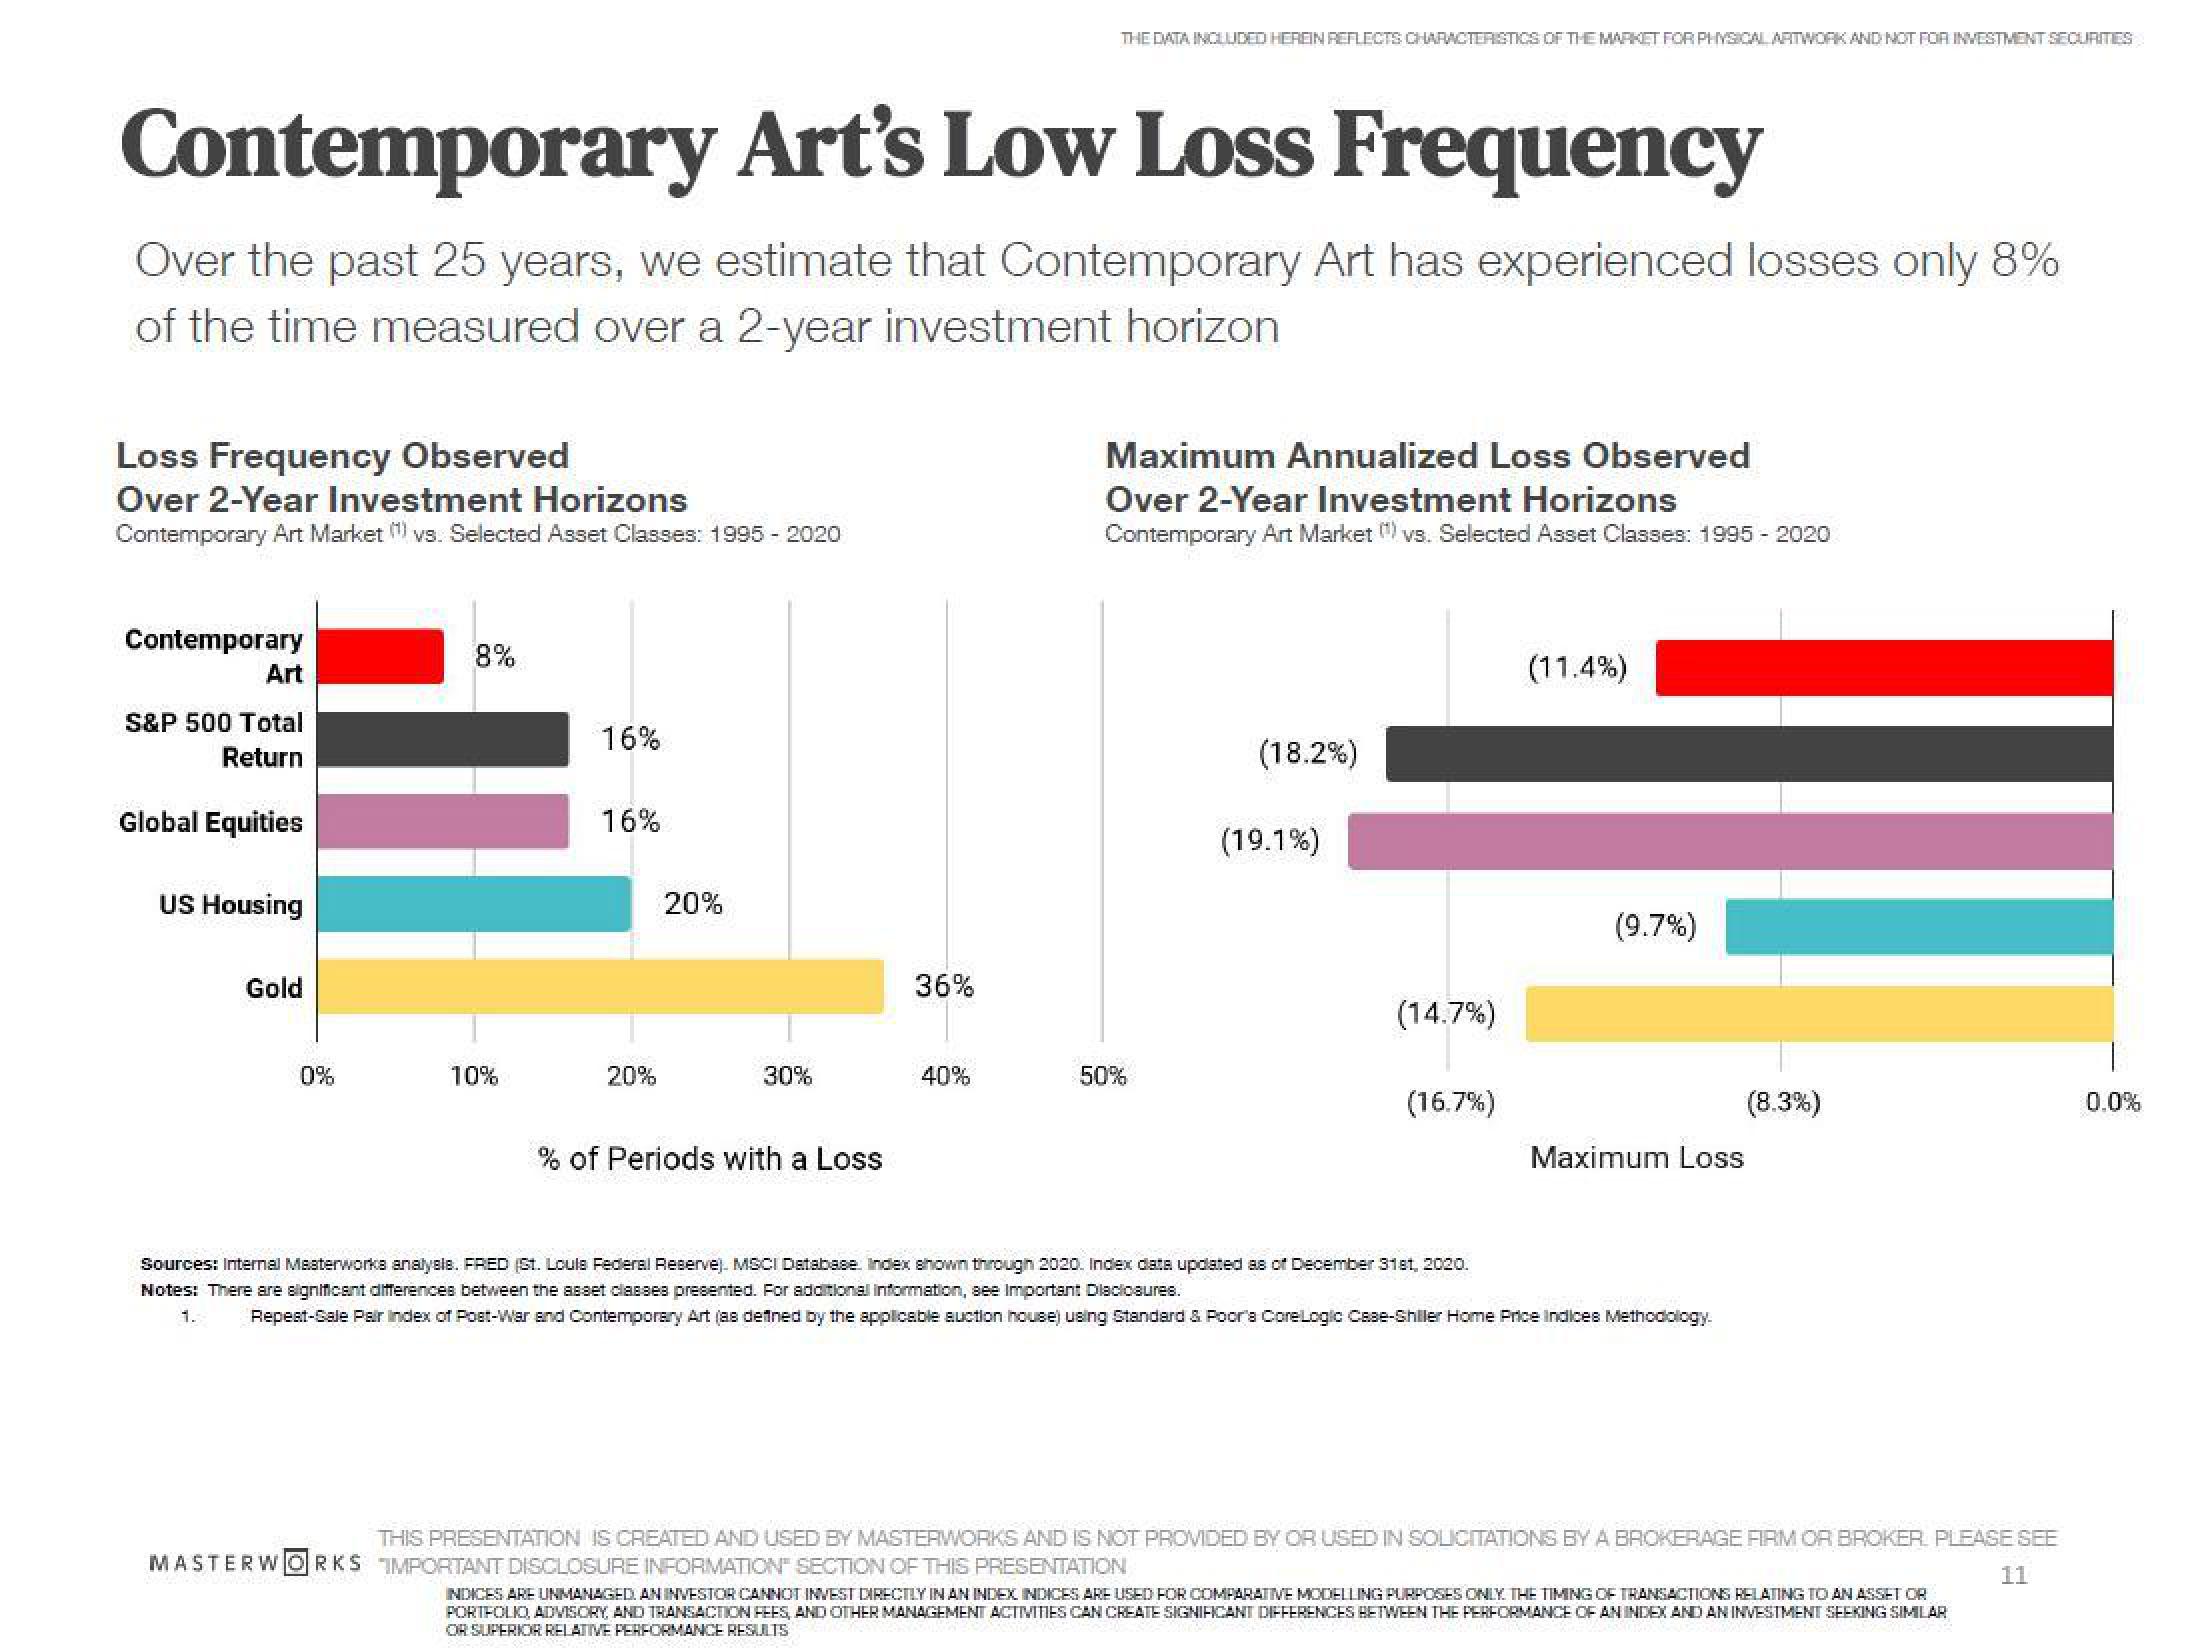
Contemporary Art's Low Loss Frequency
Over the past 25 years, we estimate that Contemporary Art has experienced losses only 8%
of the time measured over a 2-year investment horizon
Loss Frequency Observed
Over 2-Year Investment Horizons
Contemporary Art Market (¹) vs. Selected Asset Classes: 1995 - 2020
Contemporary
Art
S&P 500 Total
Return
Global Equities
US Housing
Gold
0%
8%
10%
16%
16%
20%
20%
30%
% of Periods with a Loss
36%
THE DATA INCLUDED HEREIN REFLECTS CHARACTERISTICS OF THE MARKET FOR PHYSICAL ARTWORK AND NOT FOR INVESTMENT SECURITIES
40%
Maximum Annualized Loss Observed
Over 2-Year Investment Horizons
Contemporary Art Market (¹) vs. Selected Asset Classes: 1995 - 2020
50%
(18.2%)
(19.1%)
MASTERWORKS IMPORTANT DISCLOSURE INFORMATION SECTION OF THIS PRESENTATION
(14.7%)
(16.7%)
(11.4%)
(9.7%)
Maximum Loss
Sources: Internal Masterworks analysis. FRED (St. Loula Federal Reserve). MSCI Database. Index shown through 2020. Index data updated as of December 31st, 2020.
Notes: There are significant differences between the asset classes presented. For additional information, see Important Diaclosures.
1.
Repest-Sale Pair index of Post-War and Contemporary Art (as defined by the applicable auction house) using Standard & Poor's Core Logic Case-Shiller Home Price Indices Methodology
(8.3%)
THIS PRESENTATION IS CREATED AND USED BY MASTERWORKS AND IS NOT PROVIDED BY OR USED IN SOLICITATIONS BY A BROKERAGE FIRM OR BROKER. PLEASE SEE
11
INDICES ARE UNMANAGED. AN INVESTOR CANNOT INVEST DIRECTLY IN AN INDEX INDICES ARE USED FOR COMPARATIVE MODELLING PURPOSES ONLY THE TIMING OF TRANSACTIONS RELATING TO AN ASSET OR
PORTFOLIO, ADVISORY, AND TRANSACTION FEES, AND OTHER MANAGEMENT ACTIVITIES CAN CREATE SIGNIFICANT DIFFERENCES BETWEEN THE PERFORMANCE OF AN INDEX AND AN INVESTMENT SEEKING SIMILAR
OR SUPERIOR RELATIVE PERFORMANCE RESULTS
0.0%View entire presentation