Melrose Results Presentation Deck
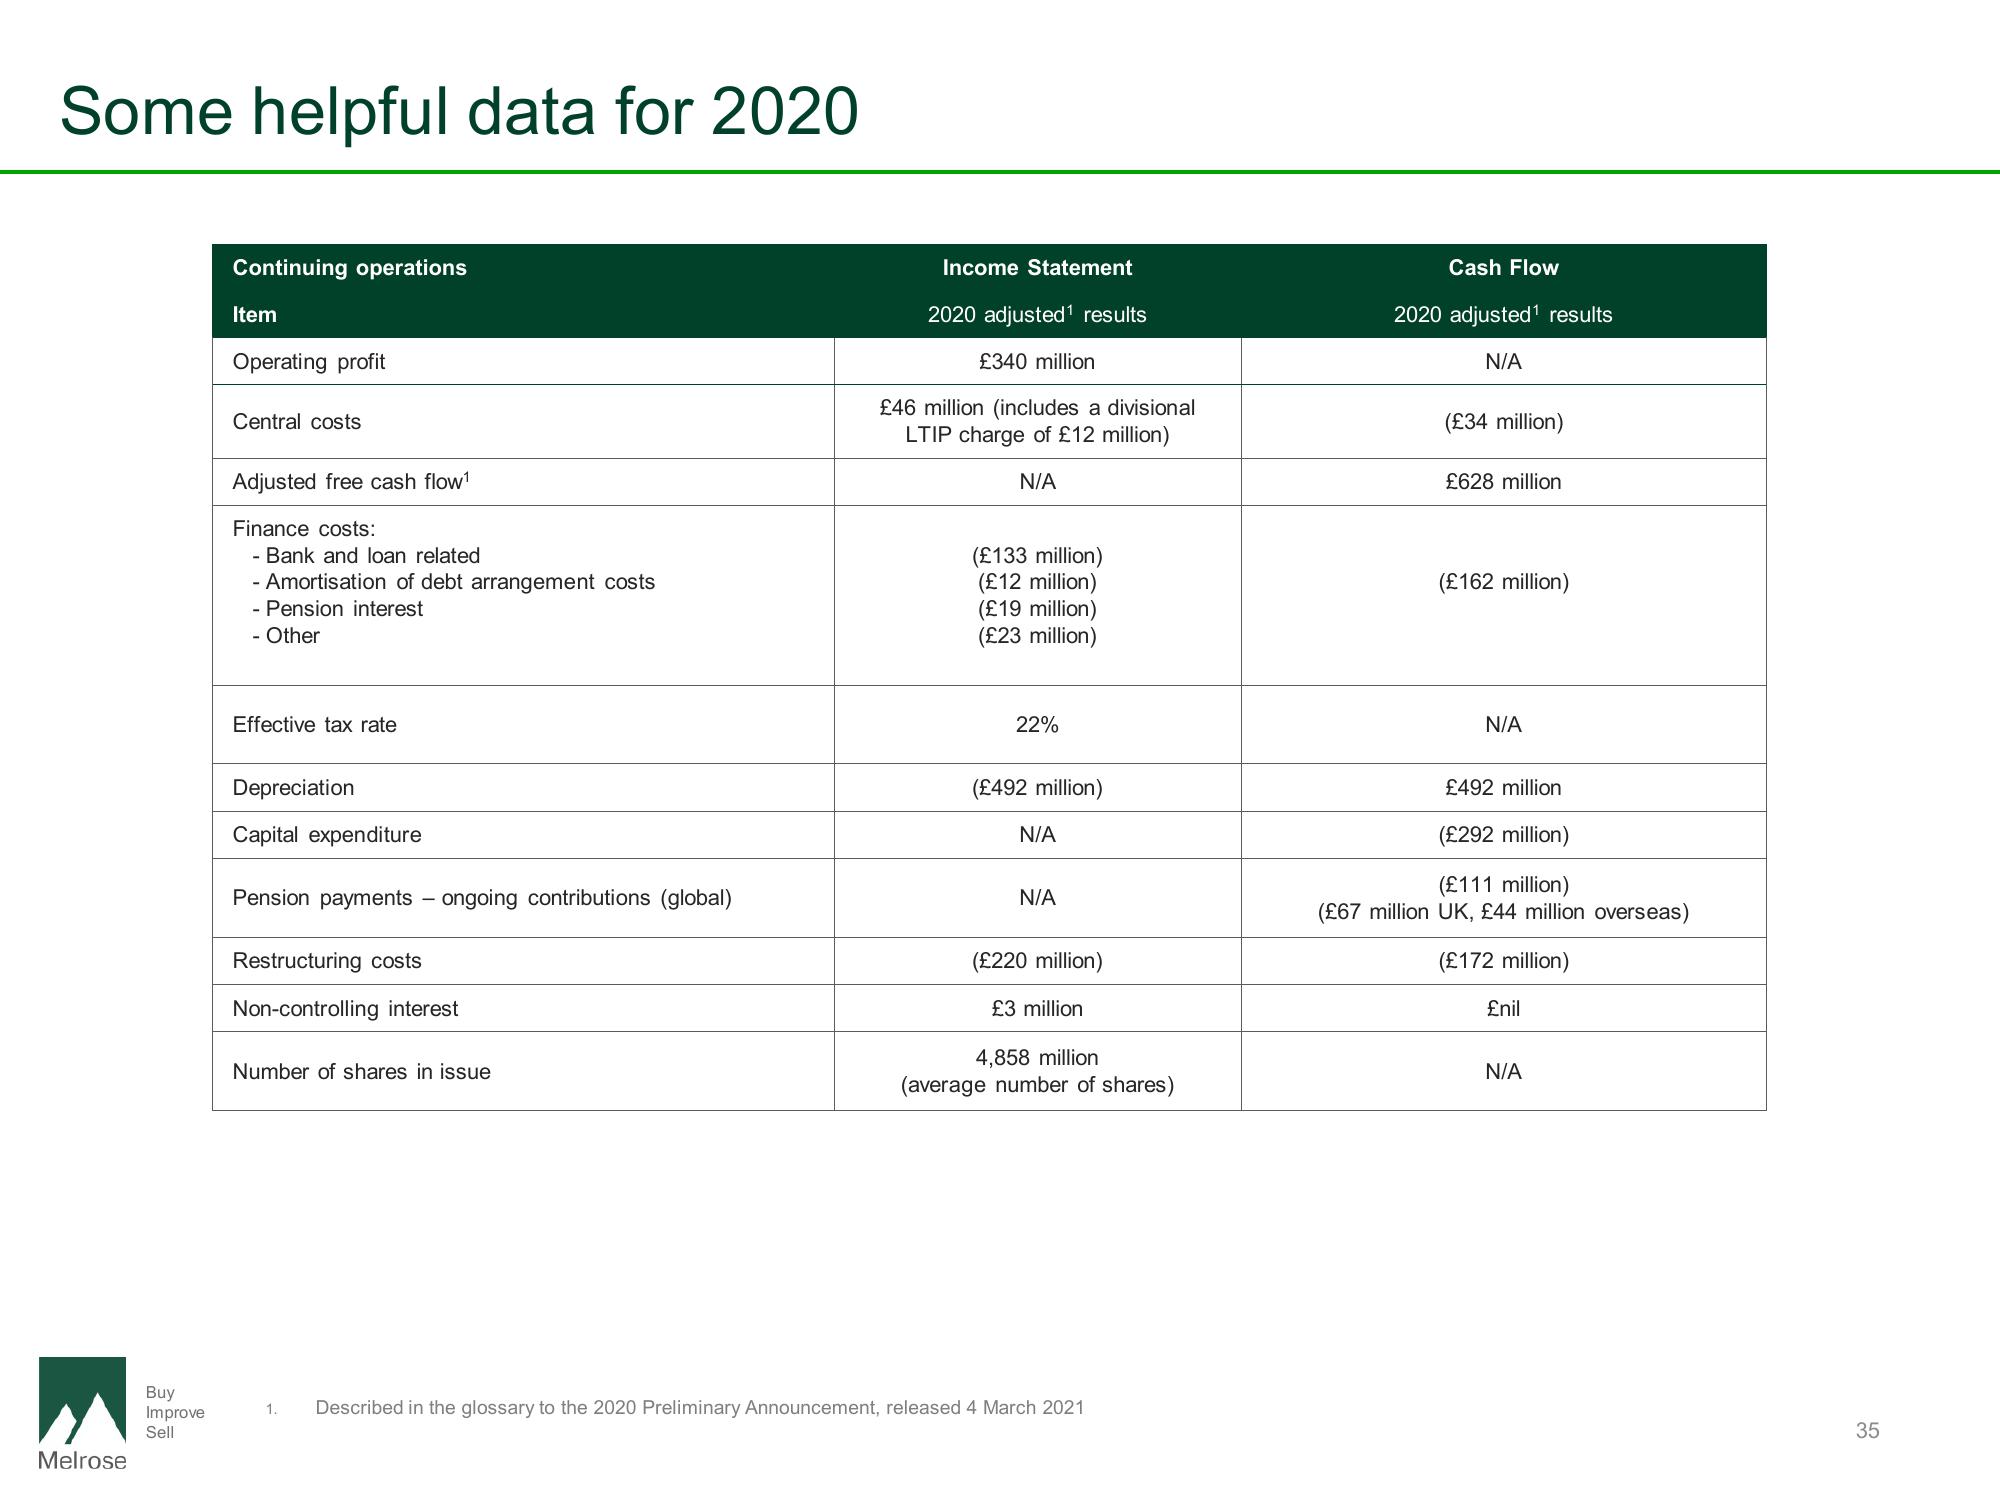
Some helpful data for 2020
Melrose
Buy
Improve
Sell
Continuing operations
Item
Operating profit
Central costs
Adjusted free cash flow¹
Finance costs:
- Bank and loan related
- Amortisation of debt arrangement costs
- Pension interest
- Other
Effective tax rate
Depreciation
Capital expenditure
Pension payments ongoing contributions (global)
Restructuring costs
Non-controlling interest
Number of shares in issue
Income Statement
2020 adjusted¹ results
£340 million
£46 million (includes a divisional
LTIP charge of £12 million)
N/A
(£133 million)
(£12 million)
(£19 million)
(£23 million)
22%
(£492 million)
N/A
N/A
(£220 million)
£3 million
4,858 million
(average number of shares)
1. Described in the glossary to the 2020 Preliminary Announcement, released 4 March 2021
Cash Flow
2020 adjusted¹ results
N/A
(£34 million)
£628 million
(£162 million)
N/A
£492 million
(£292 million)
(£111 million)
(£67 million UK, £44 million overseas)
(£172 million)
£nil
N/A
35View entire presentation