Hypebeast Results Presentation Deck
r
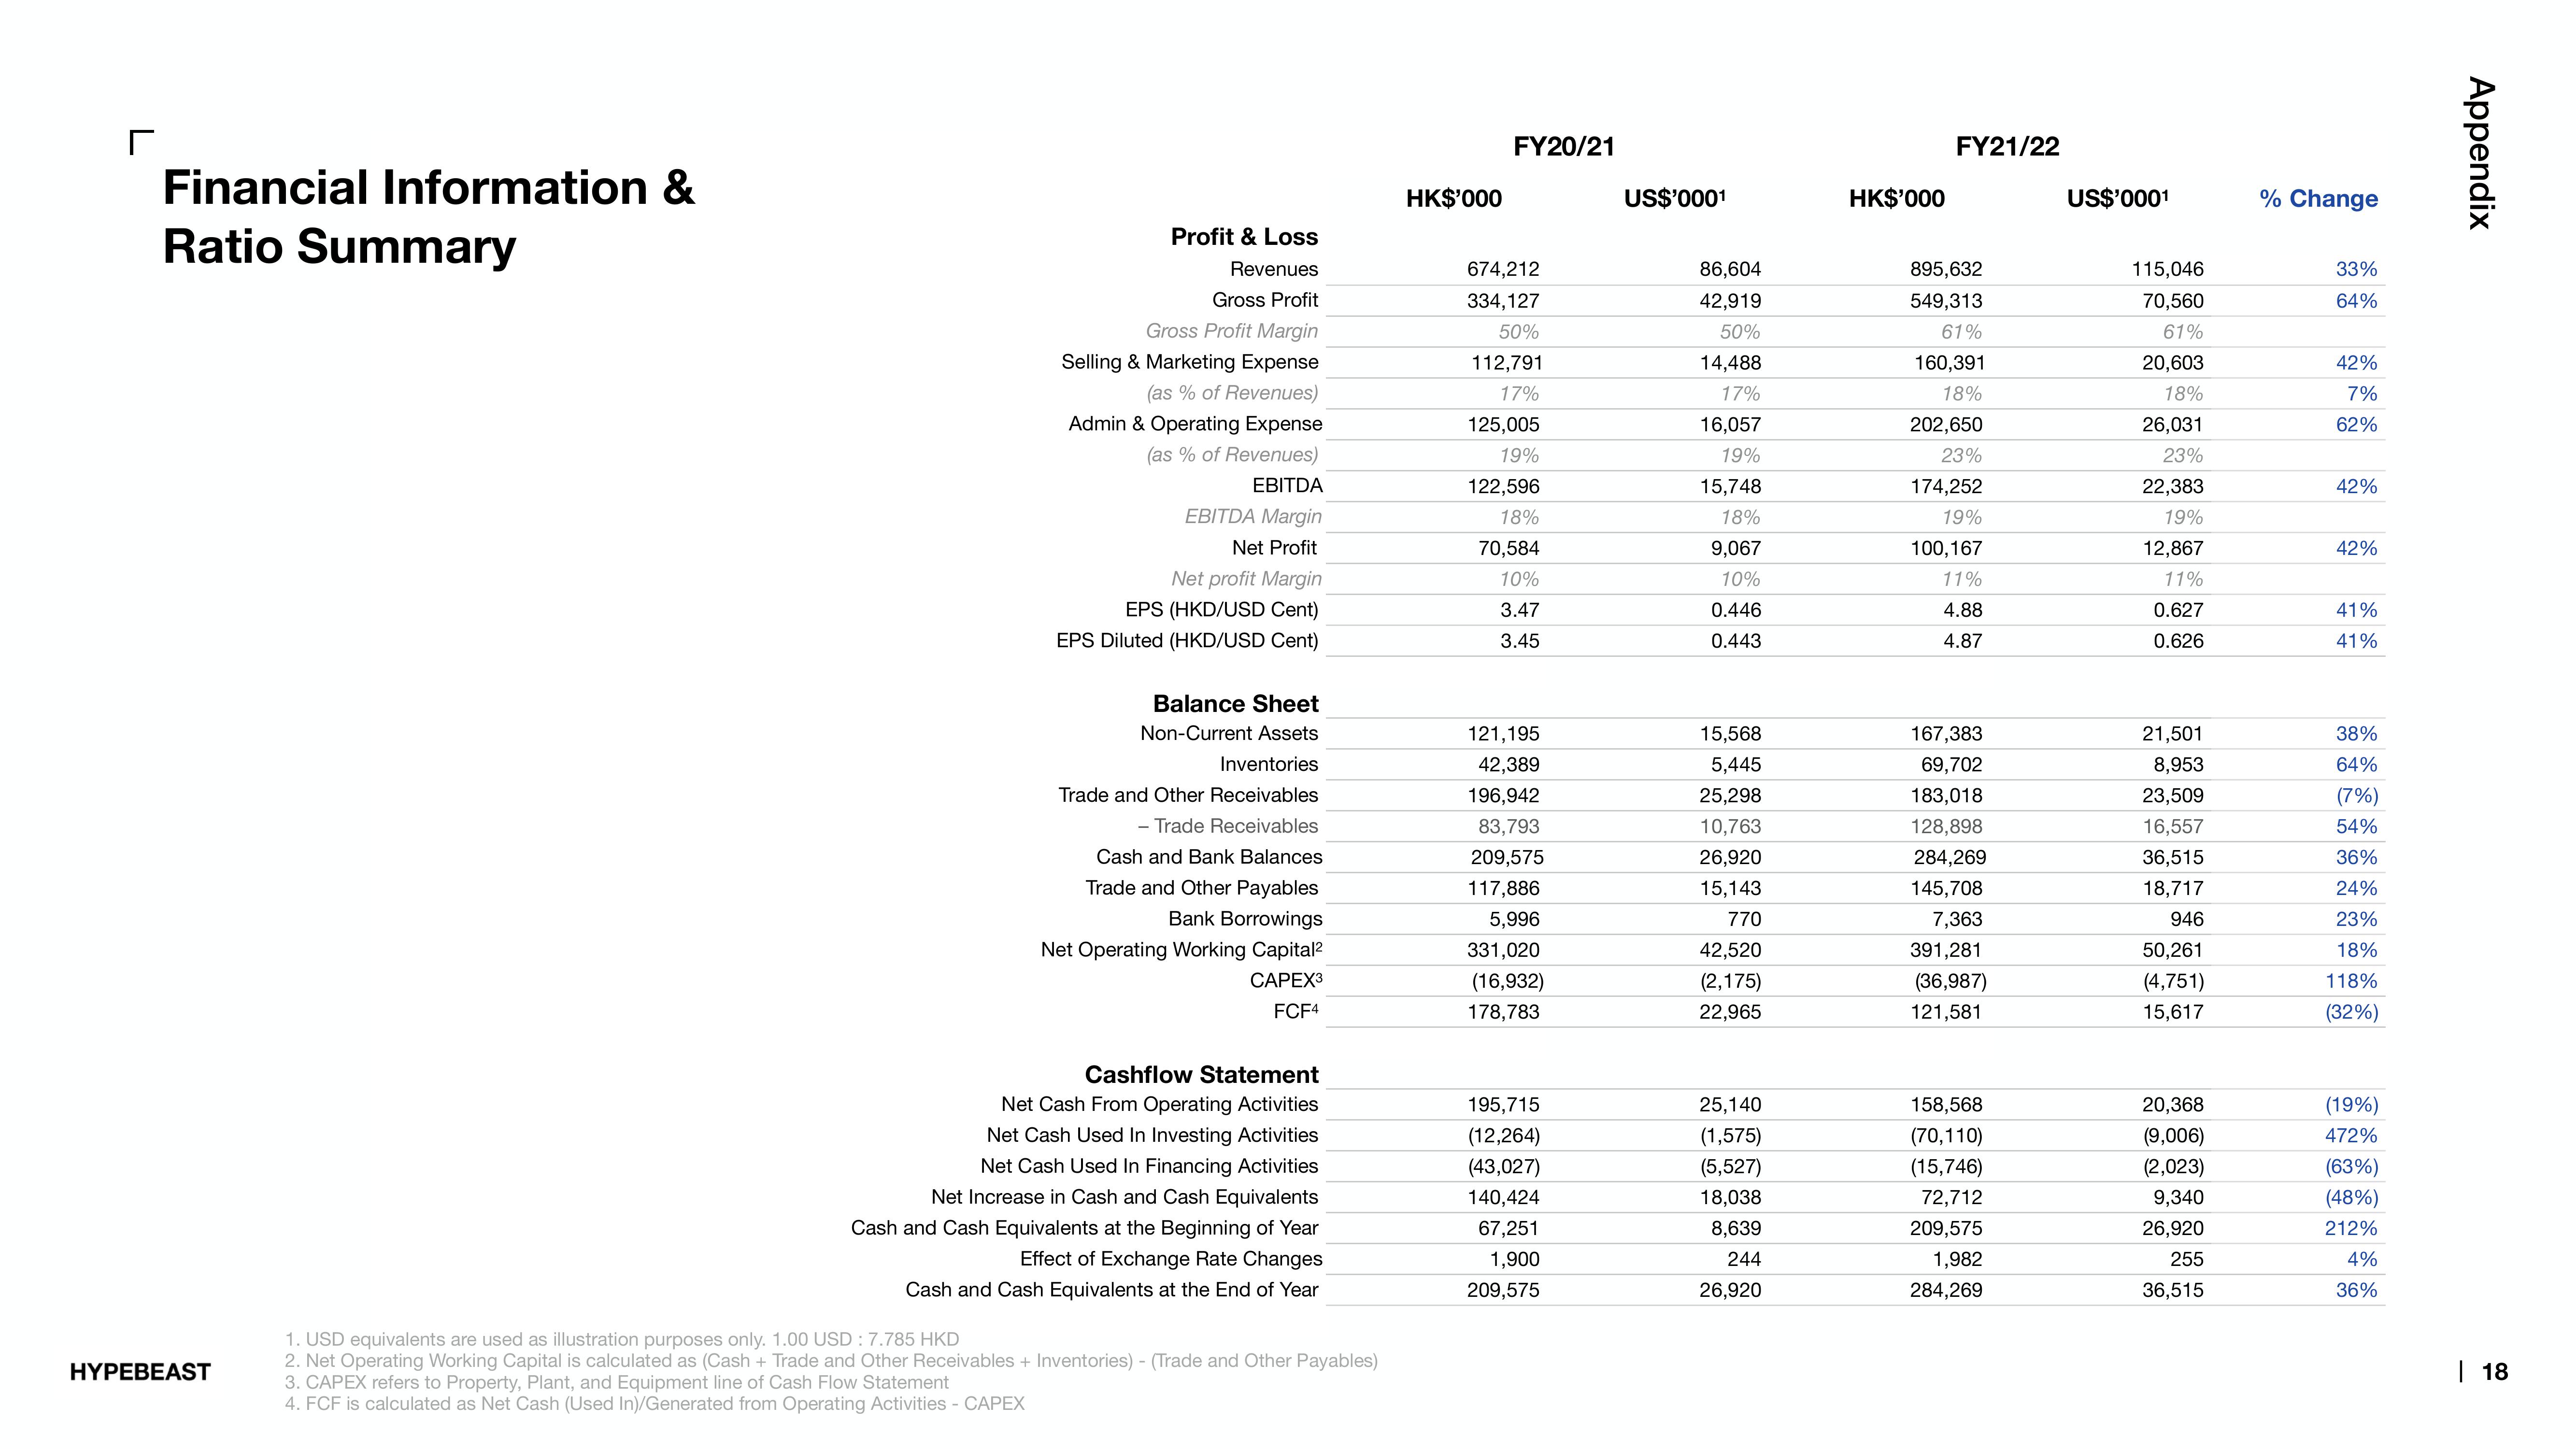
Financial Information &
Ratio Summary
HYPEBEAST
Profit & Loss
Revenues
Gross Profit
Gross Profit Margin
Selling & Marketing Expense
(as % of Revenues)
Admin & Operating Expense
(as % of Revenues)
EBITDA
EBITDA Margin
Net Profit
Net profit Margin
EPS (HKD/USD Cent)
EPS Diluted (HKD/USD Cent)
Balance Sheet
Non-Current Assets
Inventories
Trade and Other Receivables
- Trade Receivables
Cash and Bank Balances
Trade and Other Payables
Bank Borrowings
Net Operating Working Capital²
CAPEX³
FCF4
Cashflow Statement
Net Cash From Operating Activities
Net Cash Used In Investing Activities
Net Cash Used In Financing Activities
Net Increase in Cash and Cash Equivalents
Cash and Cash Equivalents at the Beginning of Year
Effect of Exchange Rate Changes
Cash and Cash Equivalents at the End of Year
1. USD equivalents are used as illustration purposes only. 1.00 USD: 7.785 HKD
2. Net Operating Working Capital is calculated as (Cash + Trade and Other Receivables + Inventories) - (Trade and Other Payables)
3. CAPEX refers to Property, Plant, and Equipment line of Cash Flow Statement
4. FCF is calculated as Net Cash (Used In)/Generated from Operating Activities - CAPEX
HK$'000
FY20/21
674,212
334,127
50%
112,791
17%
125,005
19%
122,596
18%
70,584
10%
3.47
3.45
121,195
42,389
196,942
83,793
209,575
117,886
5,996
331,020
(16,932)
178,783
195,715
(12,264)
(43,027)
140,424
67,251
1,900
209,575
US$'000¹
86,604
42,919
50%
14,488
17%
16,057
19%
15,748
18%
9,067
10%
0.446
0.443
15,568
5,445
25,298
10,763
26,920
15,143
770
42,520
(2,175)
22,965
25,140
(1,575)
(5,527)
18,038
8,639
244
26,920
HK$'000
FY21/22
895,632
549,313
61%
160,391
18%
202,650
23%
174,252
19%
100,167
11%
4.88
4.87
167,383
69,702
183,018
128,898
284,269
145,708
7,363
391,281
(36,987)
121,581
158,568
(70,110)
(15,746)
72,712
209,575
1,982
284,269
US$'000¹
115,046
70,560
61%
20,603
18%
26,031
23%
22,383
19%
12,867
11%
0.627
0.626
21,501
8,953
23,509
16,557
36,515
18,717
946
50,261
(4,751)
15,617
20,368
(9,006)
(2,023)
9,340
26,920
255
36,515
% Change
33%
64%
42%
7%
62%
42%
42%
41%
41%
38%
64%
(7%)
54%
36%
24%
23%
18%
118%
(32%)
(19%)
472%
(63%)
(48%)
212%
4%
36%
Appendix
| 18View entire presentation