LionTree Investment Banking Pitch Book
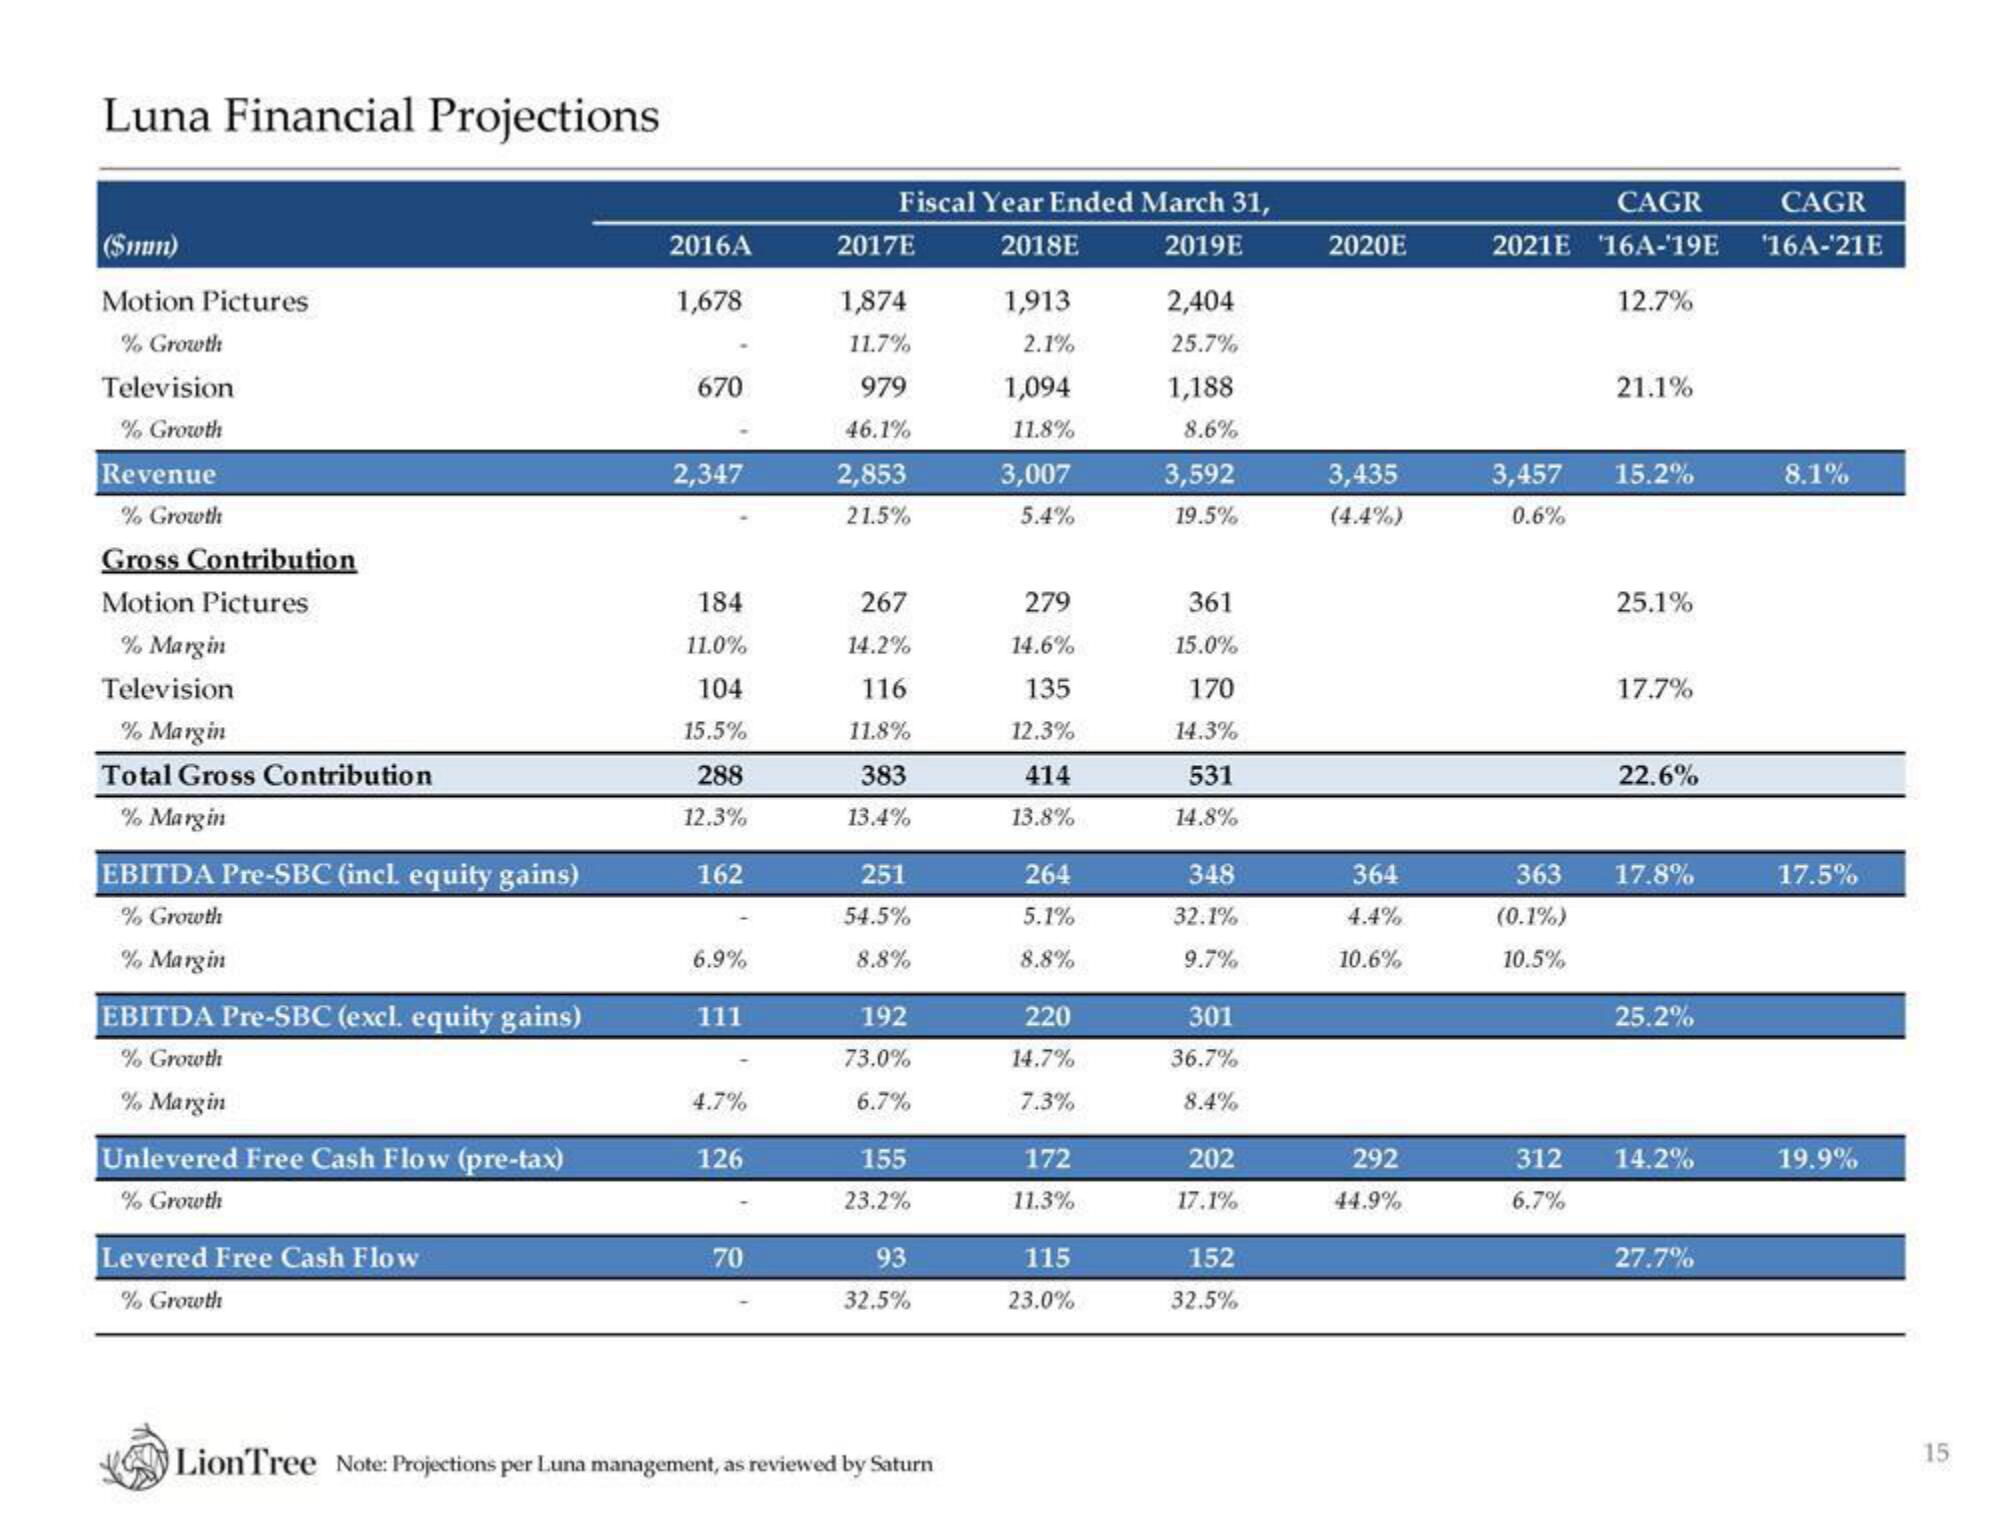
Luna Financial Projections
($mm)
Motion Pictures
% Growth
Television
% Growth
Revenue
% Growth
Gross Contribution
Motion Pictures
% Margin
Television
% Margin
Total Gross Contribution
% Margin
EBITDA Pre-SBC (incl. equity gains)
% Growth
% Margin
EBITDA Pre-SBC (excl. equity gains)
% Growth
% Margin
Unlevered Free Cash Flow (pre-tax)
% Growth
Levered Free Cash Flow
% Growth
2016A
1,678
670
2,347
184
11.0%
104
15.5%
288
12.3%
162
6.9%
111
4.7%
126
70
Fiscal Year Ended March 31,
2018E
2019E
2017E
1,874
11.7%
979
46.1%
2,853
21.5%
267
14.2%
116
11.8%
383
13.4%
251
54.5%
8.8%
192
73.0%
6.7%
155
23.2%
93
32.5%
LionTree Note: Projections per Luna management, as reviewed by Saturn
1,913
2.1%
1,094
11.8%
3,007
5.4%
279
14.6%
135
12.3%
414
13.8%
264
5.1%
8.8%
220
14.7%
7.3%
172
11.3%
115
23.0%
2,404
25.7%
1,188
8.6%
3,592
19.5%
361
15.0%
170
14.3%
531
14.8%
348
32.1%
9.7%
301
36.7%
8.4%
202
17.1%
152
32.5%
2020E
3,435
364
4.4%
10.6%
292
44.9%
CAGR
CAGR
2021E 16A-'19E '16A-¹21E
12.7%
3,457 15.2%
0.6%
363
(0.1%)
10.5%
21.1%
312
6.7%
25.1%
17.7%
22.6%
17.8%
25.2%
14.2%
27.7%
8.1%
17.5%
19.9%
15View entire presentation