Evercore Investment Banking Pitch Book
Preliminary Financial Analysis
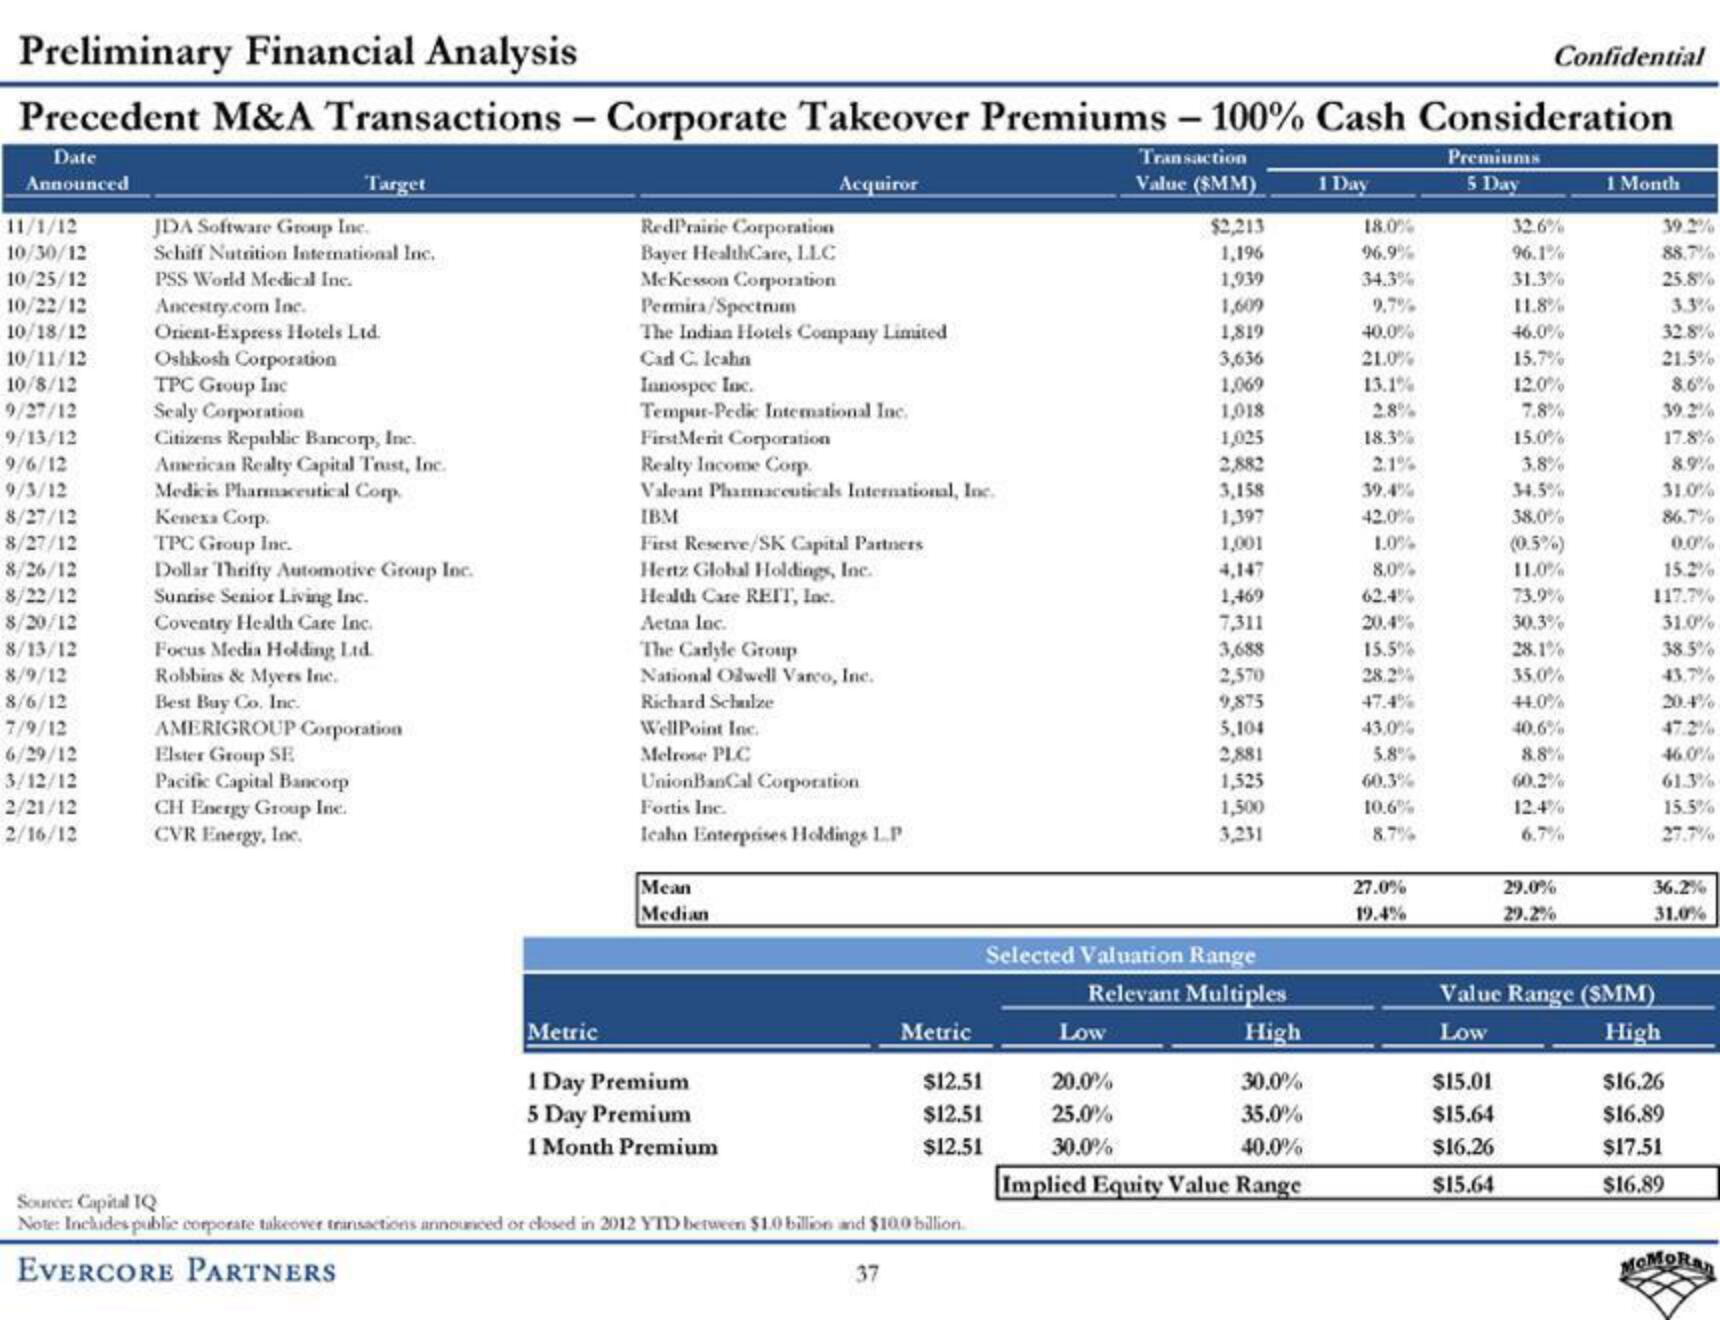
Precedent M&A Transactions - Corporate Takeover Premiums - 100% Cash Consideration
Transaction
Acquiror
Value (SMM)
$2,213
1,196
1,939
1,609
1,819
Date
Announced
11/1/12
10/30/12
10/25/12
10/22/12
10/18/12
10/11/12
10/8/12
9/27/12
9/13/12
9/6/12
9/3/12
8/27/12
8/27/12
8/26/12
8/22/12
8/20/12
8/13/12
8/9/12
8/6/12
7/9/12
6/29/12
3/12/12
2/21/12
2/16/12
JDA Software Group Inc.
Schiff Nutrition International Inc.
PSS World Medical Inc.
Ancestry.com Inc.
Target
Orient Express Hotels Ltd.
Oshkosh Corporation
TPC Group Inc
Sealy Corporation
Citizens Republic Bancorp, Inc.
American Realty Capital Trust, Inc.
Medicis Pharmaceutical Corp.
Kenexa Corp.
TPC Group Inc.
Dollar Thrifty Automotive Group Inc.
Sunrise Senior Living Inc.
Coventry Health Care Inc.
Focus Media Holding Ltd.
Robbins & Myers Inc.
Best Buy Co. Inc.
AMERIGROUP Corporation
Elster Group SE
Pacific Capital Bancorp
CH Energy Group Inc.
CVR Energy, Inc.
RedPrairie Corporation
Bayer HealthCare, LLC
McKesson Corporation
Permira/Spectrum
The Indian Hotels Company Limited
Cad C. Icahn
Innospec Inc.
Tempur-Pedic Intemational Inc.
FirstMerit Corporation
Realty Income Corp.
Valeant Pharmaceuticals International, Inc.
IBM
First Reserve/SK Capital Partners
Hertz Global Holdings, Inc.
Health Care REIT, Inc.
Aetna Inc.
The Carlyle Group
National Olwell Varco, Inc.
Richard Schulze
WellPoint Inc.
Melrose PLC
UnionBanCal Corporation
Fortis Inc.
Icahn Enterprises Holdings L.P
Mean
Median
Metric
1 Day Premium
5 Day Premium
1 Month Premium
Metric
$12.51
$12.51
$12.51
Source: Capital IQ
Note: Includes public corporate takeover transactions announced or closed in 2012 YTD between $1.0 billion and $100 billion.
EVERCORE PARTNERS
37
3,636
1,069
1,018
1,025
2,882
3,158
1,397
1,001
4,147
1,469
7,311
3,688
2,570
9,875
5,104
2,881
1,525
1,500
3,231
Selected Valuation Range
Low
20.0%
25.0%
30.0%
Relevant Multiples
High
30.0%
35.0%
40.0%
Implied Equity Value Range
1 Day
18.0%
96.9%
9,7%
40.0%
21.0%
13.1%
2.8%
18.3%
2.1%
42.0%
1.0%
8,0%
62.4%
20.4%
15.5%
28.2%
47.4%
43.0%
5.8%
60.3%
10.6%
8.7%
27.0%
19.4%
Premiums
5 Day
Confidential
$15.01
$15.64
$16.26
$15.64
32.6%
96.1%
31.3%
11.8%
46.0%
15.7%
12.0%
7.8%
15.0%
3.8%
38.0%
(0.5%)
11.0%
73.9%
30.3%
28.1%
35,0%
44.0%
40.6%
8.8%
60.2%
12.4%
6.7%
29.0%
29.2%
1 Month
39.2%
88.7%
25.8%
3.3%
32.8%
21.5%
8.6%
17.8%
8.9%
31.0%
86.7%
0.0%
15.2%
117.7%
31.0%
38.5%
43,7%
20.4%
Value Range (SMM)
Low
High
46.0%
61.3%
15.5%
27.7%
36.2%
31.0%
$16.26
$16.89
$17.51
$16.89
MOMORANView entire presentation