Spotify Results Presentation Deck
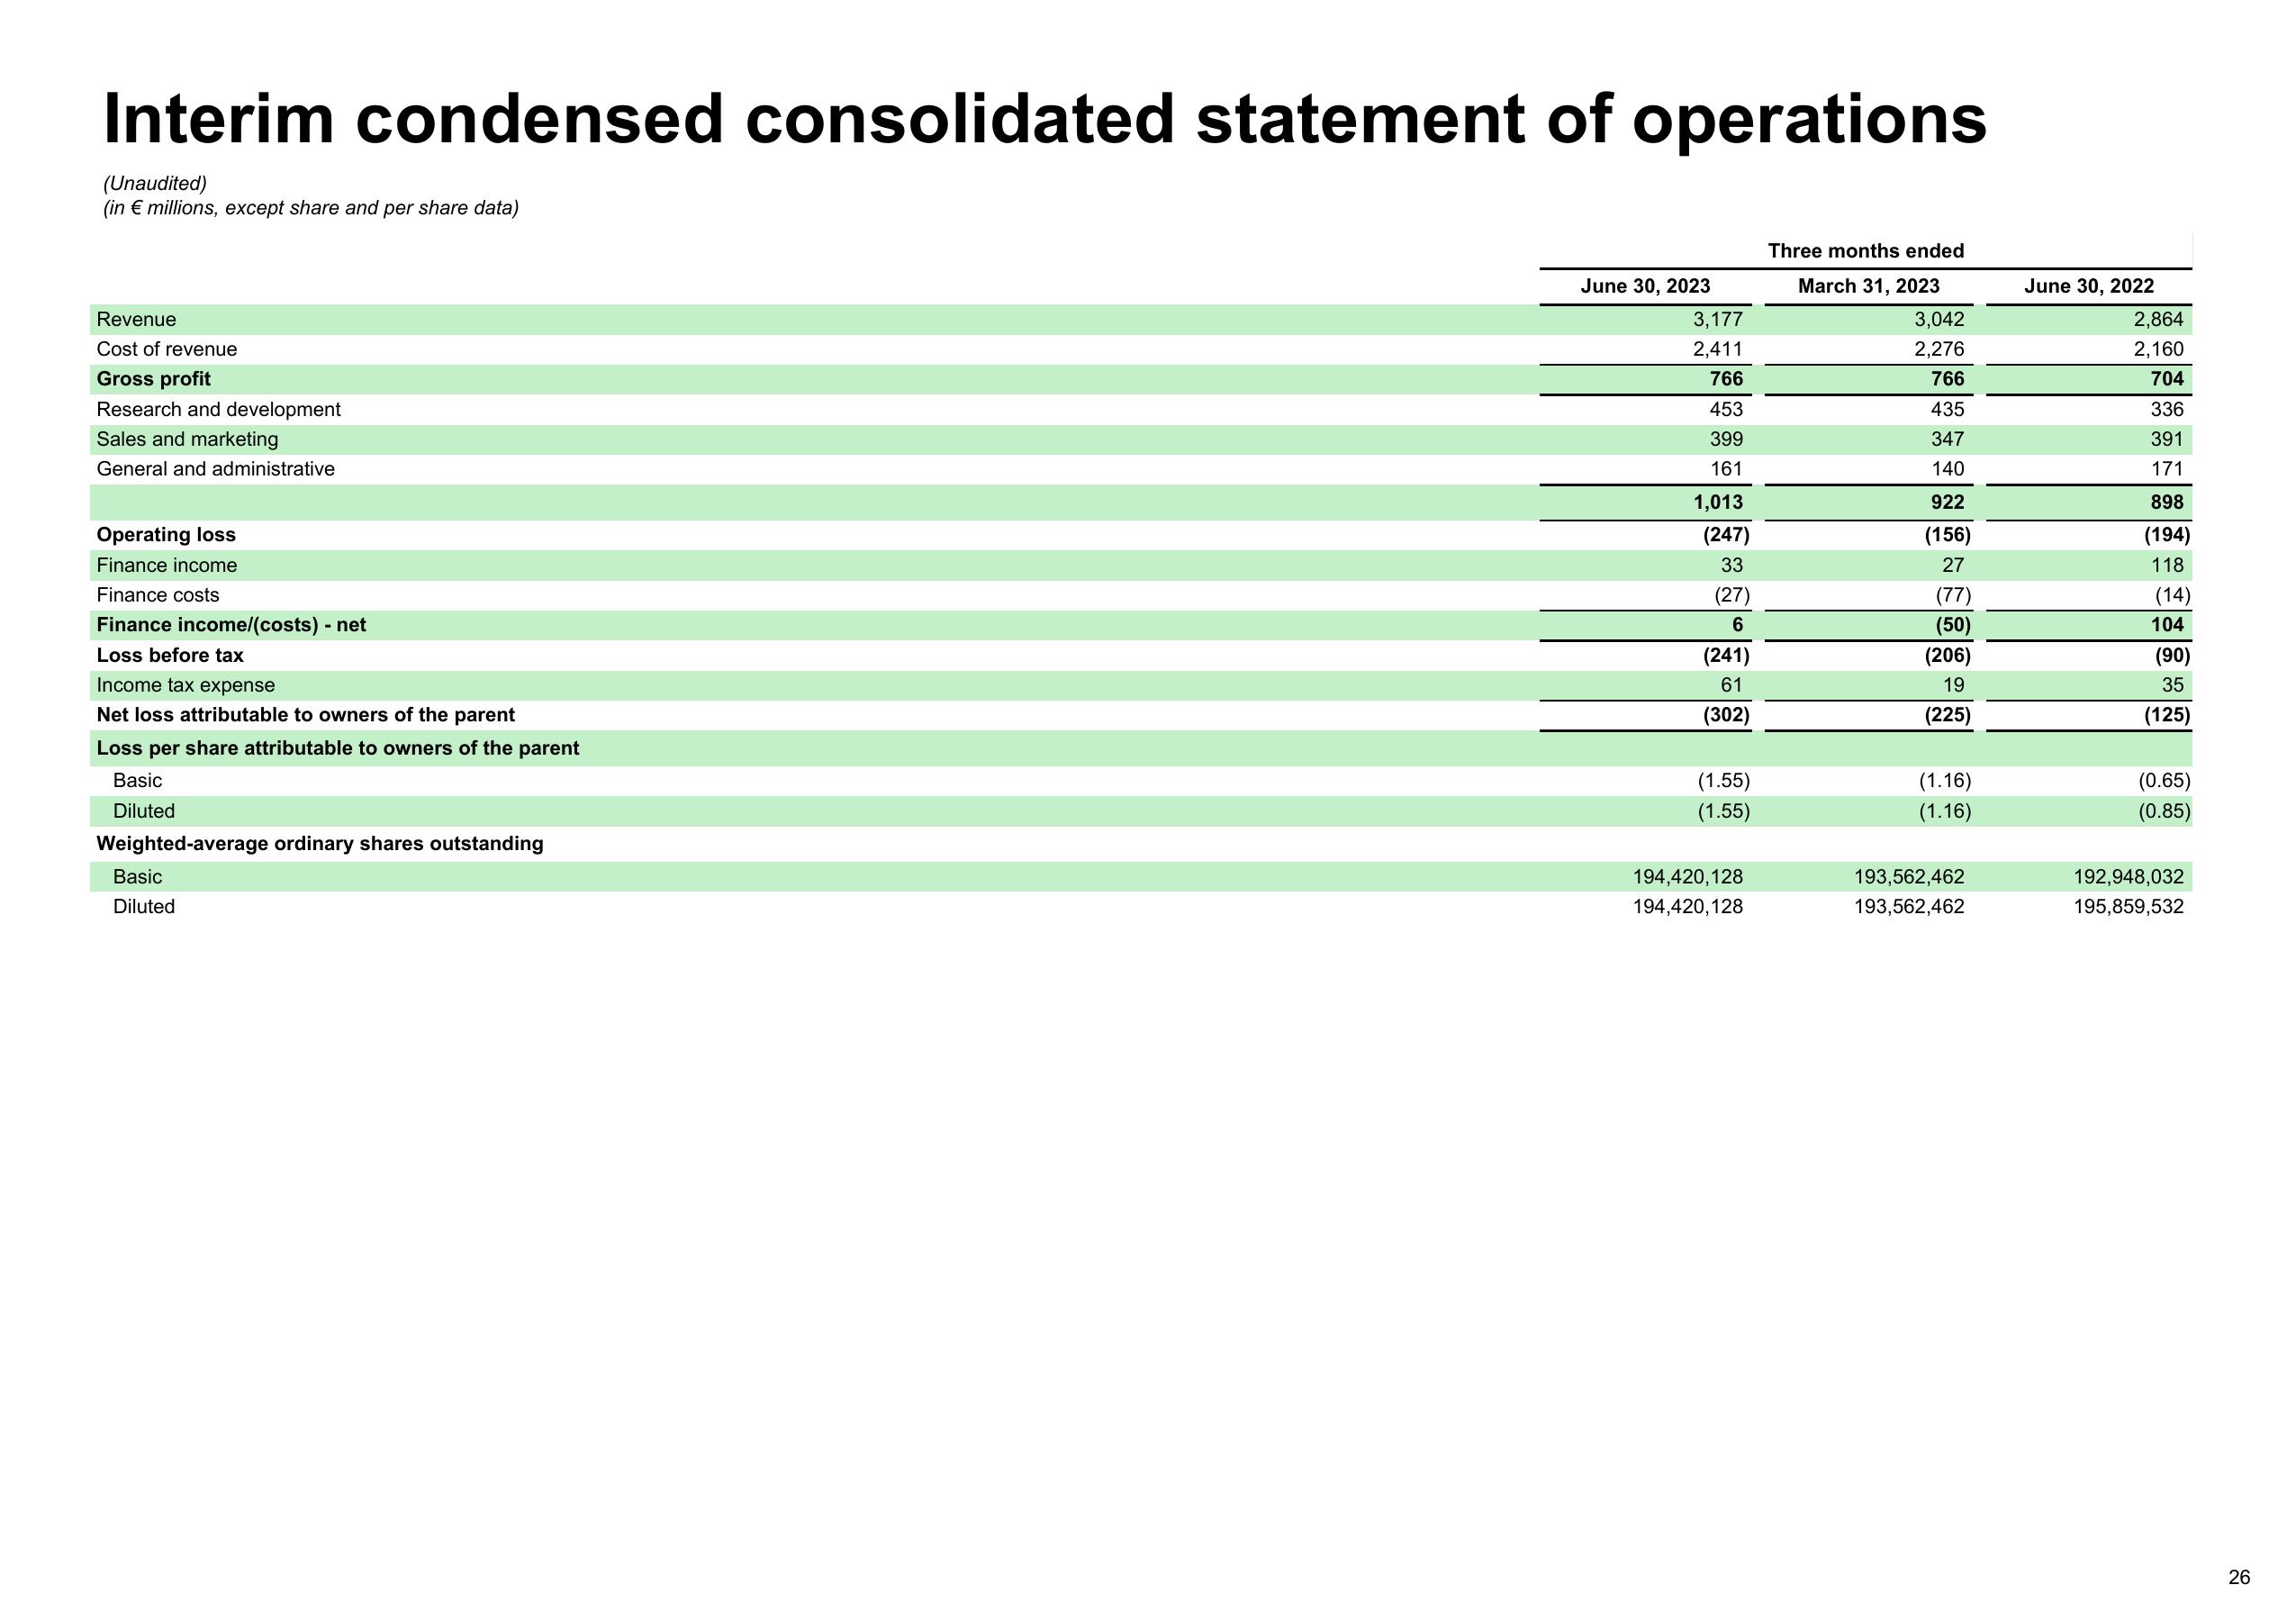
Interim condensed consolidated statement of operations
(Unaudited)
(in € millions, except share and per share data)
Revenue
Cost of revenue
Gross profit
Research and development
Sales and marketing
General and administrative
Operating loss
Finance income
Finance costs
Finance income/(costs) - net
Loss before tax
Income tax expense
Net loss attributable to owners of the parent
Loss per share attributable to owners of the parent
Basic
Diluted
Weighted-average ordinary shares outstanding
Basic
Diluted
June 30, 2023
3,177
2,411
766
453
399
161
1,013
(247)
33
(27)
6
(241)
61
(302)
(1.55)
(1.55)
194,420,128
194,420,128
Three months ended
March 31, 2023
3,042
2,276
766
435
347
140
922
(156)
27
(77)
(50)
(206)
19
(225)
(1.16)
(1.16)
193,562,462
193,562,462
June 30, 2022
2,864
2,160
704
336
391
171
898
(194)
118
(14)
104
(90)
35
(125)
(0.65)
(0.85)
192,948,032
195,859,532
26View entire presentation