J.P.Morgan Investment Banking Pitch Book
VALUATION ANALYSIS
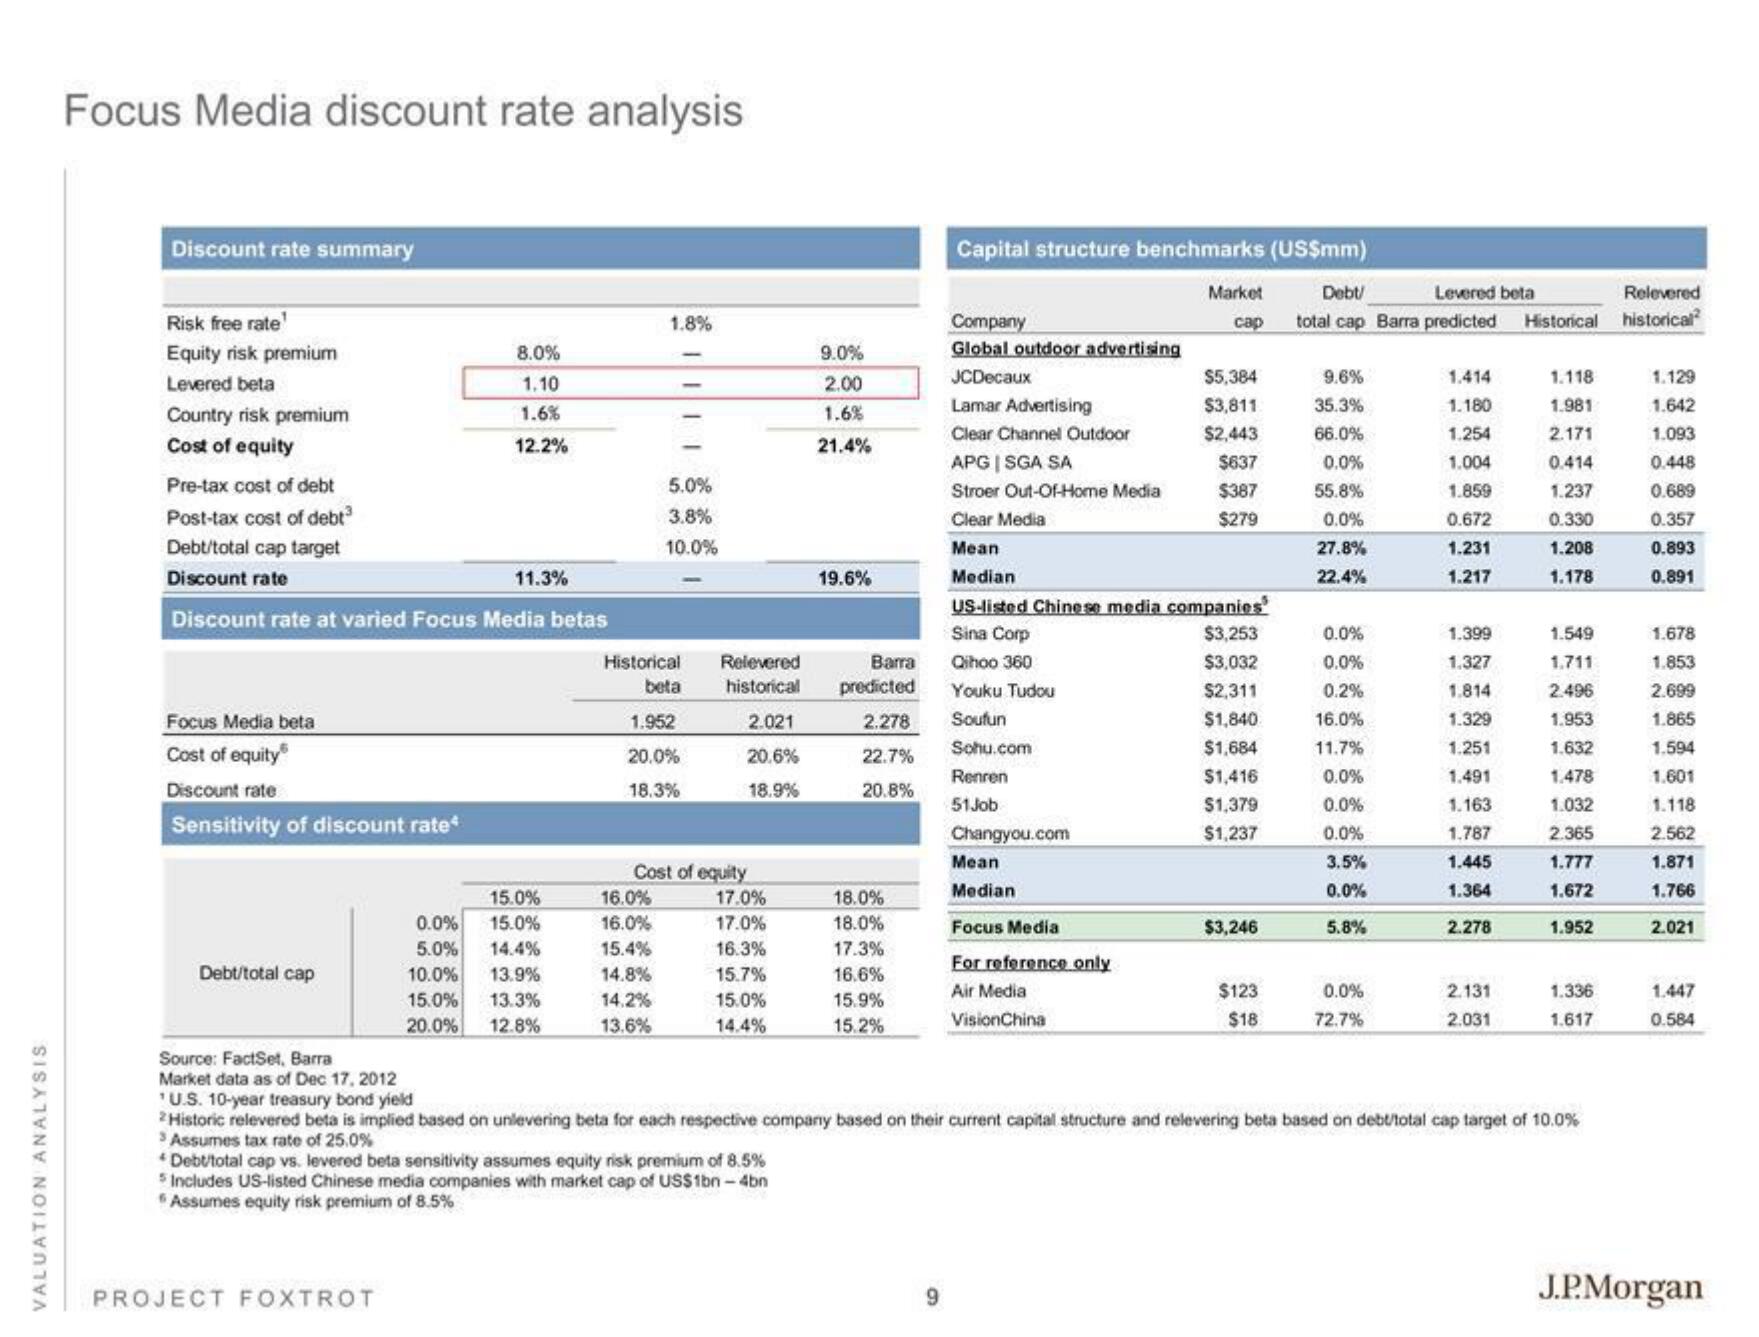
Focus Media discount rate analysis
Discount rate summary
Risk free rate¹
Equity risk premium
Levered beta
Country risk premium
Cost of equity
Pre-tax cost of debt
Post-tax cost of debt³
Debt/total cap target
Discount rate
11.3%
Discount rate at varied Focus Media betas
Focus Media beta
Cost of equity
Discount rate
Sensitivity of discount rate*
Debt/total cap
8.0%
1.10
1.6%
12.2%
15.0%
0.0% 15.0%
5.0% 14.4%
10.0% 13.9%
15.0% 13.3%
20.0% 12.8%
PROJECT FOXTROT
1.8%
5.0%
3.8%
10.0%
Historical
beta
1.952
20.0%
18.3%
16.0%
16.0%
15.4%
14.8%
14.2%
13.6%
Cost of equit
Relevered
Barra
historical predicted
2.021
2.278
20.6%
22.7%
18.9%
20.8%
17.0%
17.0%
16.3%
15.7%
15.0%
14.4%
9.0%
2.00
1.6%
21.4%
*Debt/total cap vs. levered beta sensitivity assumes equity risk premium of 8.5%
5 Includes US-listed Chinese media companies with market cap of US$1bn-4bn
Assumes equity risk premium of 8.5%
19.6%
18.0%
18.0%
17.3%
16.6%
15.9%
15.2%
Capital structure benchmarks (US$mm)
9
Company
Global outdoor advertising
JCDecaux
Lamar Advertising
Clear Channel Outdoor
APG | SGA SA
Stroer Out-Of-Home Media
Clear Media
Mean
Median
US-listed Chinese media companies
$3,253
$3,032
$2,311
$1,840
$1,684
$1,416
$1,379
$1,237
Sina Corp
Gihoo 360
Youku Tudou
Soufun
Sohu.com
Renren
51Job
Changyou.com
Mean
Median
Market
cap
Focus Media
For reference only
Air Media
VisionChina
$5,384
$3,811
$2,443
$637
$387
$279
$3,246
$123
$18
Debt/
total cap Barra predicted
9.6%
35.3%
66.0%
55.8%
0.0%
27.8%
22.4%
0.0%
0.0%
0.2%
16.0%
11.7%
0.0%
0.0%
0.0%
3.5%
0.0%
5.8%
0.0%
72.7%
Levered beta
1.414
1.180
1.254
1.004
1.859
0.672
1.231
1.217
1.399
1.327
1.814
1.329
1.251
1.491
1.163
1.787
1.445
1.364
2.278
2.131
2.031
Historical
1.118
1.981
2.171
1.237
0.330
1.208
1.178
Source: FactSet, Barra
Market data as of Dec 17, 2012
U.S. 10-year treasury bond yield
Historic relevered beta is implied based on unlevering beta for each respective company based on their current capital structure and relevering beta based on debutotal cap target of 10.0%
3 Assumes tax rate of 25.0%
1.549
1.711
2.496
1.953
1.632
1.478
1.032
2.365
1.777
1.672
1.952
1.336
1.617
Relevered
historical²
1.129
1.642
1.093
148
0.689
0.357
0.893
0.891
1.678
1.853
2.699
1.865
1.594
1.601
1.118
2.562
1.871
1.766
2.021
1.447
0.584
J.P.MorganView entire presentation