SoftBank Investor Presentation Deck
SVF1
PROGRESS & HIGHLIGHTS
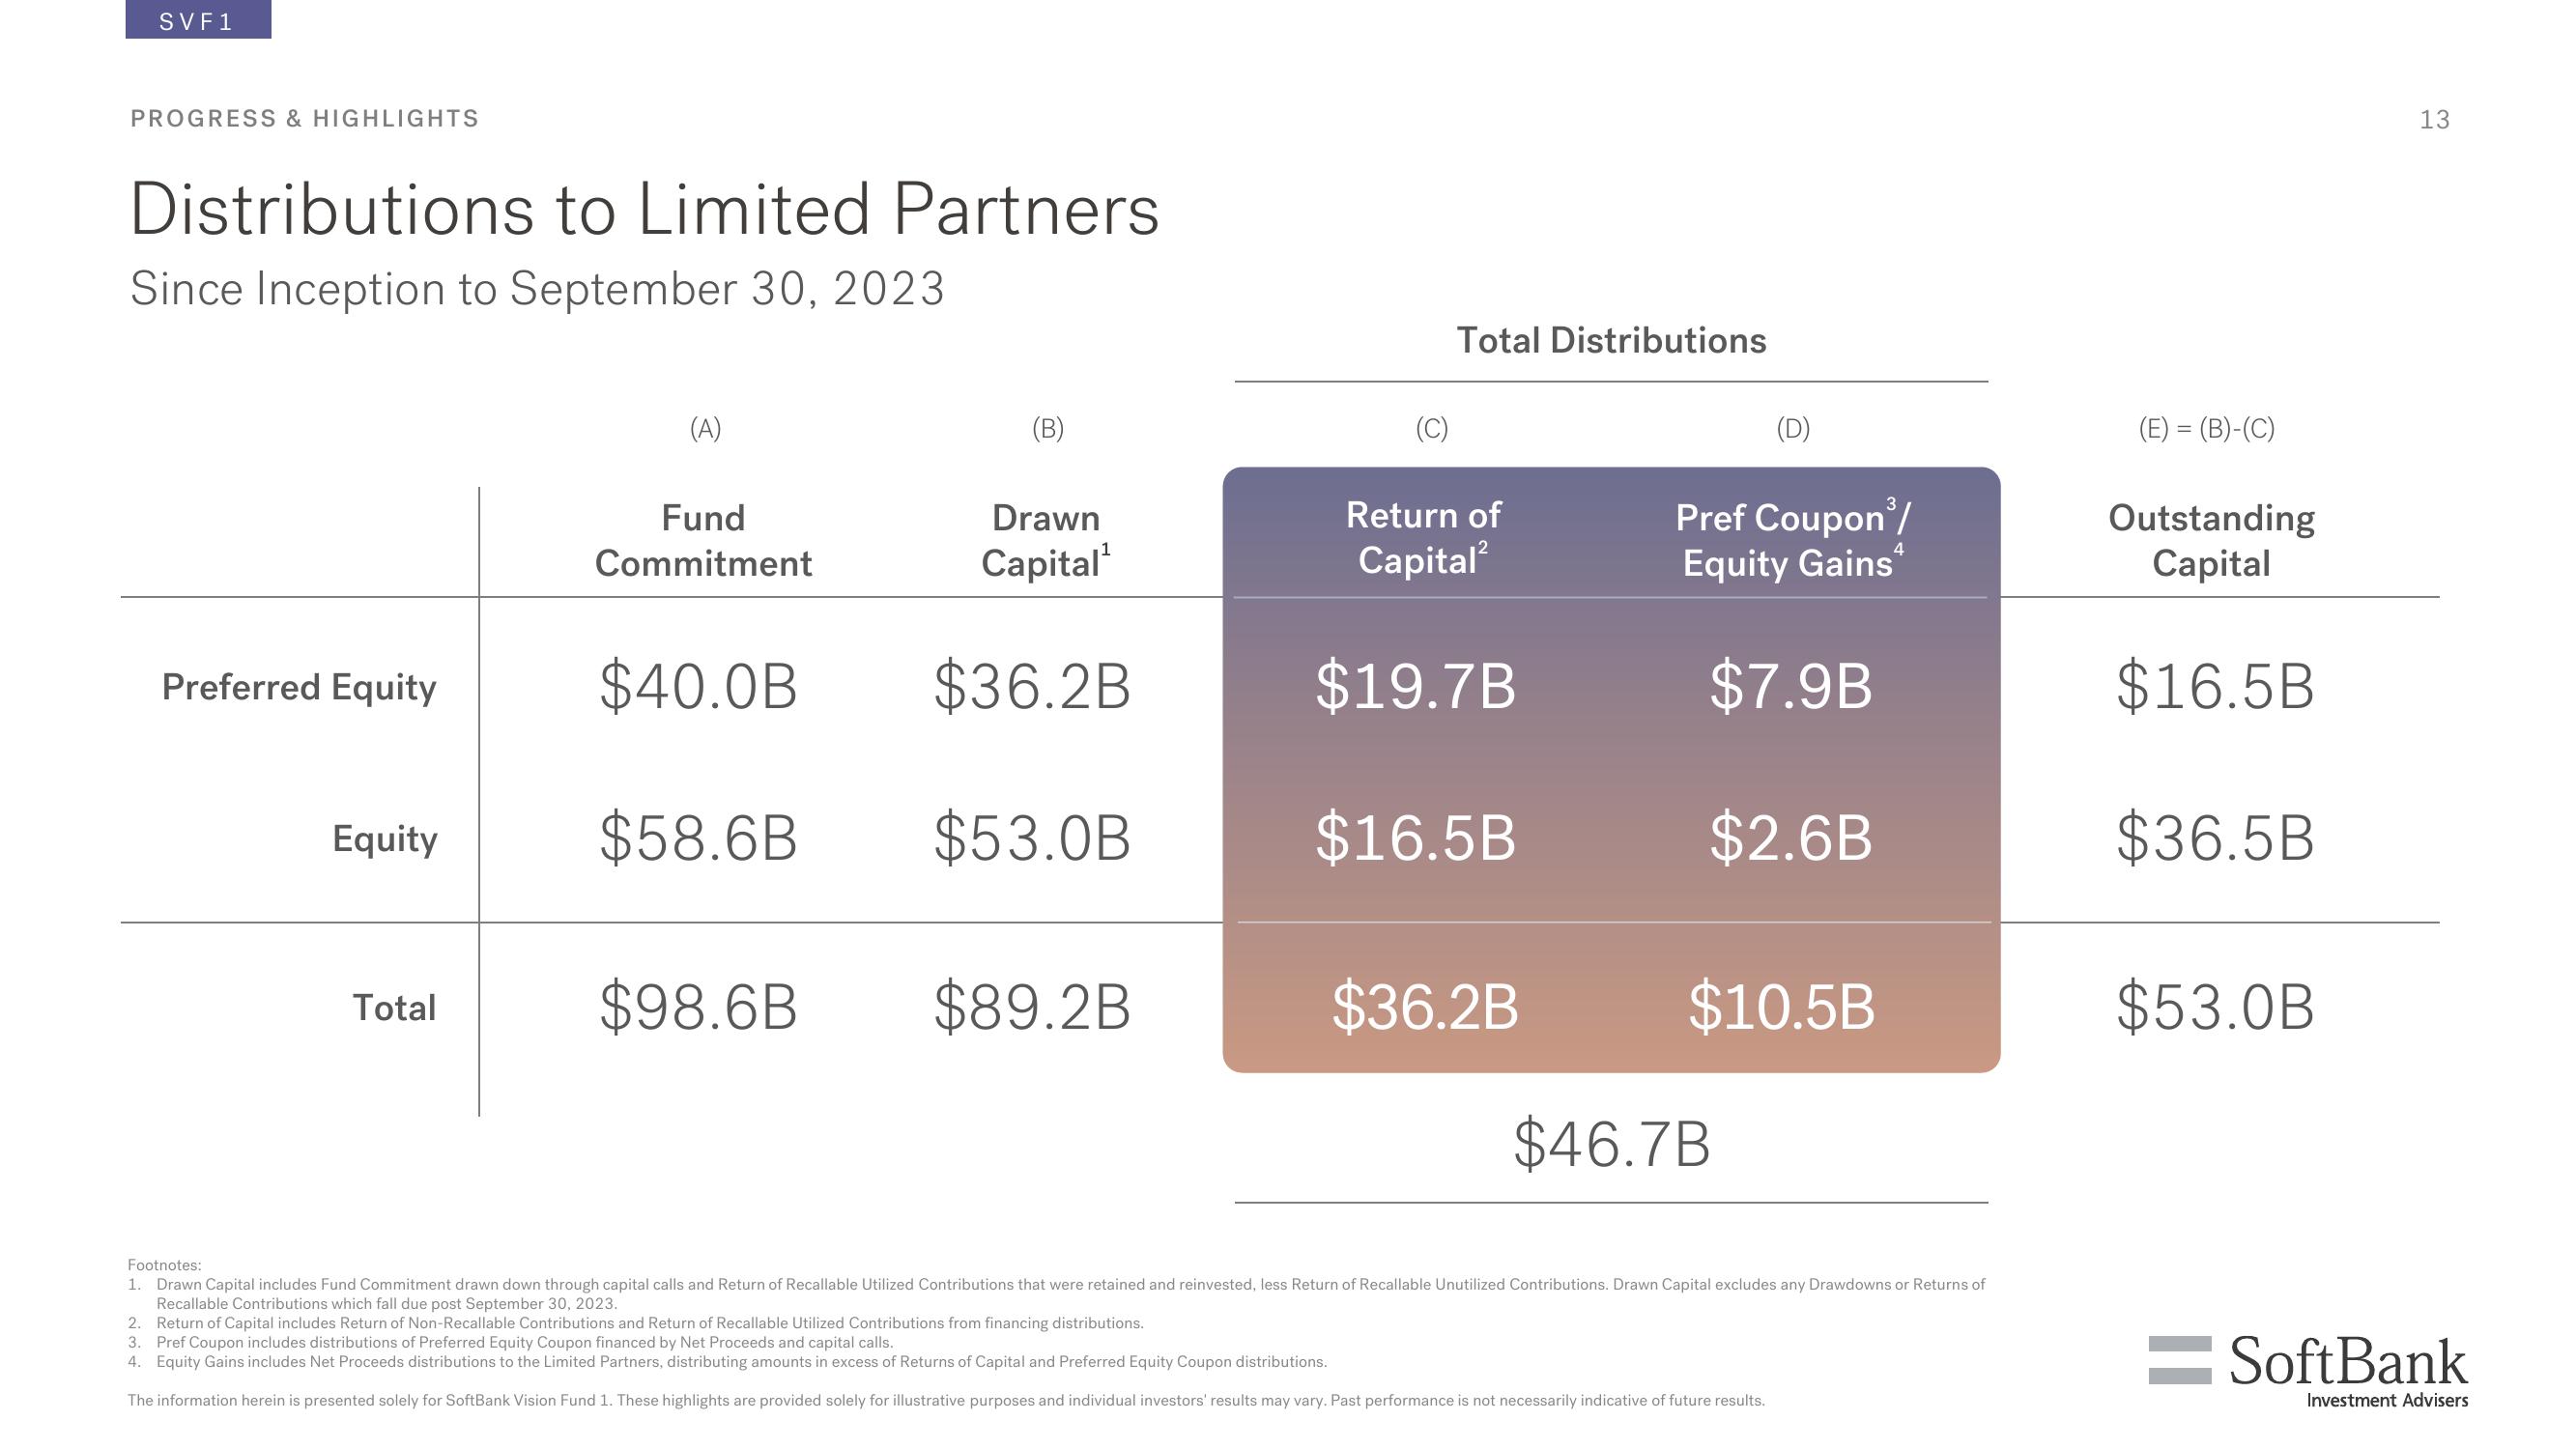
Distributions to Limited Partners
Since Inception to September 30, 2023
Preferred Equity
Equity
Total
(A)
Fund
Commitment
$40.0B
$58.6B
$98.6B
Drawn
Capital ¹
$36.2B
$53.0B
$89.2B
Total Distributions
Return of
Capital²
$19.7B
$16.5B
$36.2B
Pref Coupon³/
Equity Gains
(D)
$7.9B
$2.6B
$10.5B
$46.7B
2. Return of Capital includes Return of Non-Recallable Contributions and Return of Recallable Utilized Contributions from financing distributions.
3. Pref Coupon includes distributions of Preferred Equity Coupon financed by Net Proceeds and capital calls.
4. Equity Gains includes Net Proceeds distributions to the Limited Partners, distributing amounts in excess of Returns of Capital and Preferred Equity Coupon distributions.
The information herein is presented solely for SoftBank Vision Fund 1. These highlights are provided solely for illustrative purposes and individual investors' results may vary. Past performance is not necessarily indicative of future results.
4
Footnotes:
1. Drawn Capital includes Fund Commitment drawn down through capital calls and Return of Recallable Utilized Contributions that were retained and reinvested, less Return of Recallable Unutilized Contributions. Drawn Capital excludes any Drawdowns or Returns of
Recallable Contributions which fall due post September 30, 2023.
(E) = (B)-(C)
Outstanding
Capital
$16.5B
$36.5B
$53.0B
13
=SoftBank
Investment AdvisersView entire presentation