UBS Results Presentation Deck
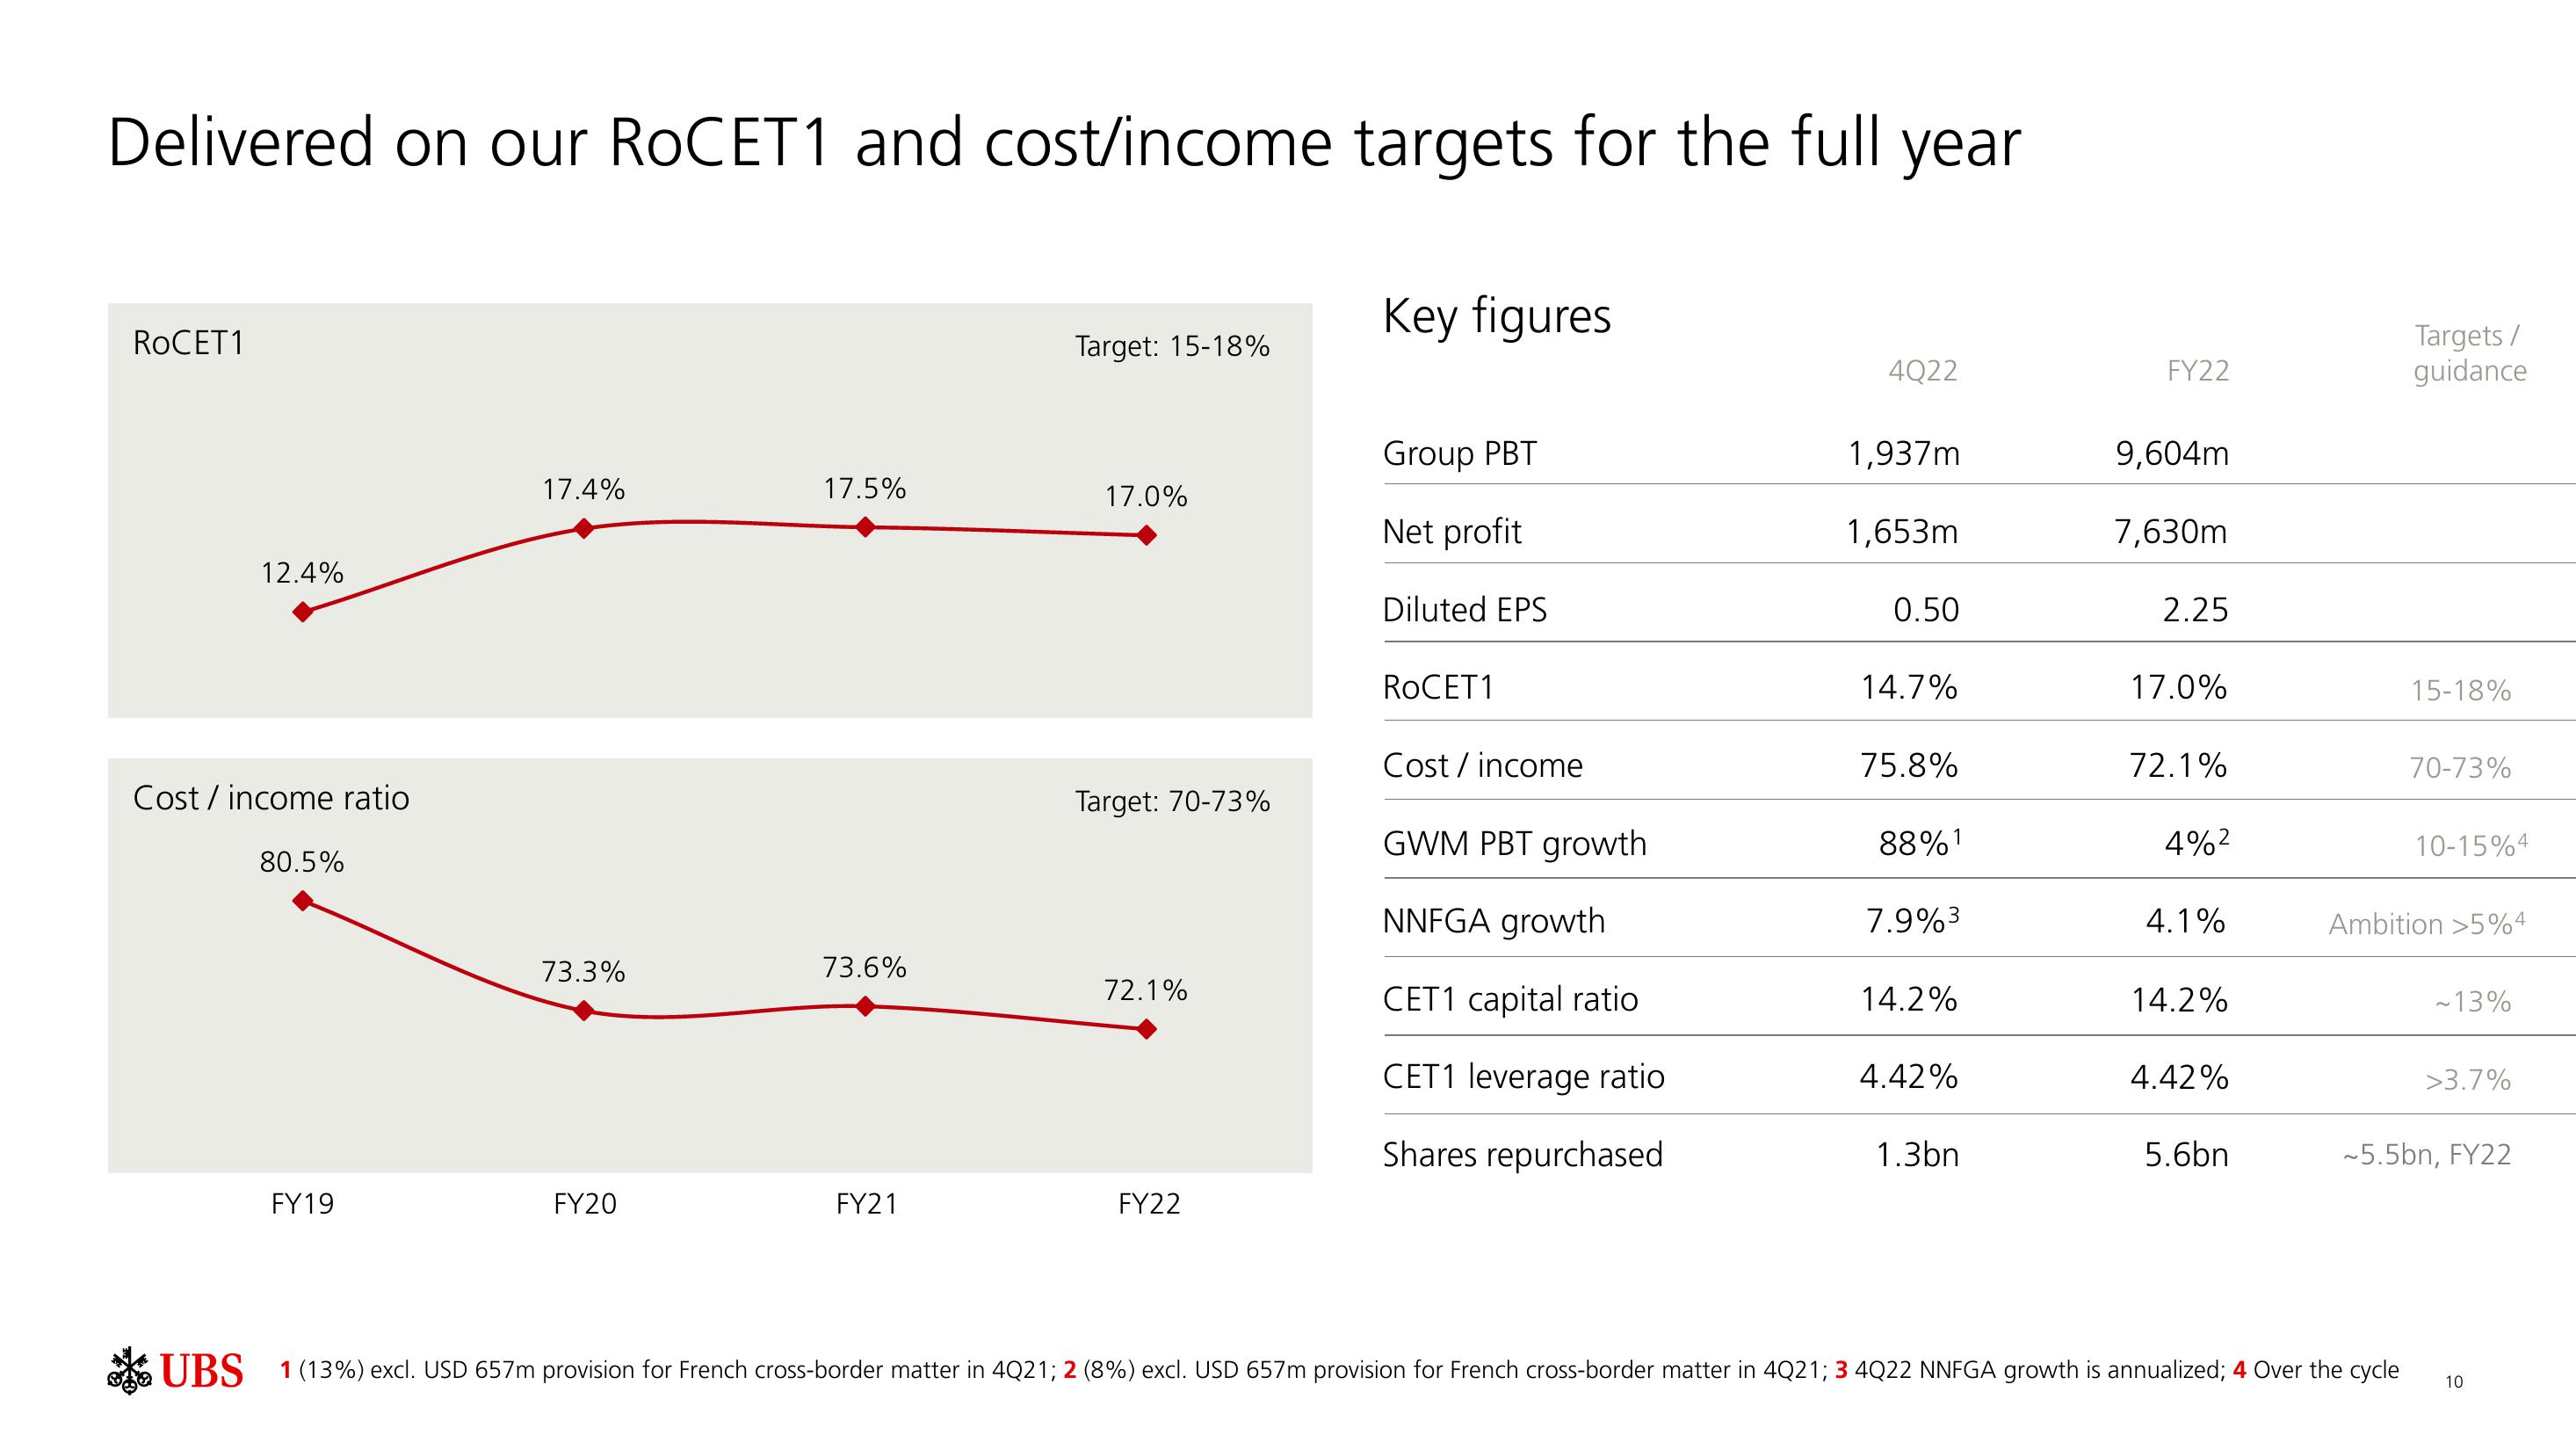
Delivered on our ROCET1 and cost/income targets for the full year
RoCET1
12.4%
Cost/ income ratio
80.5%
FY19
17.4%
73.3%
FY20
17.5%
73.6%
FY21
Target: 15-18%
17.0%
Target: 70-73%
72.1%
FY22
Key figures
Group PBT
Net profit
Diluted EPS
RoCET1
Cost / income
GWM PBT growth
NNFGA growth
CET1 capital ratio
CET1 leverage ratio
Shares repurchased
4Q22
1,937m
1,653m
0.50
14.7%
75.8%
88% 1
7.9%³
14.2%
4.42%
1.3bn
FY22
9,604m
7,630m
2.25
17.0%
72.1%
4%²
4.1%
14.2%
4.42%
5.6bn
Targets /
guidance
15-18%
UBS 1(13%) excl. USD 657m provision for French cross-border matter in 4Q21; 2 (8%) excl. USD 657m provision for French cross-border matter in 4Q21; 3 4Q22 NNFGA growth is annualized; 4 Over the cycle
70-73%
10-15%4
Ambition >5%4
~13%
>3.7%
~5.5bn, FY22
10View entire presentation