Pathward Financial Results Presentation Deck
CAPITAL AND SOURCES OF LIQUIDITY
REGULATORY CAPITAL AS OF MARCH 31, 2021
At March 31, 2021¹
Tier 1 Leverage
Tier 1 Leverage - EIP-adjusted²
Common Equity Tier 1
Tier 1 Capital
Total Capital
●
●
●
Meta Financial Group, Inc. MetaBank, N.A.
5.47%
7.39%
13.32%
13.33%
14.60%
4.75%
N/A
11.24%
11.58%
14.59%
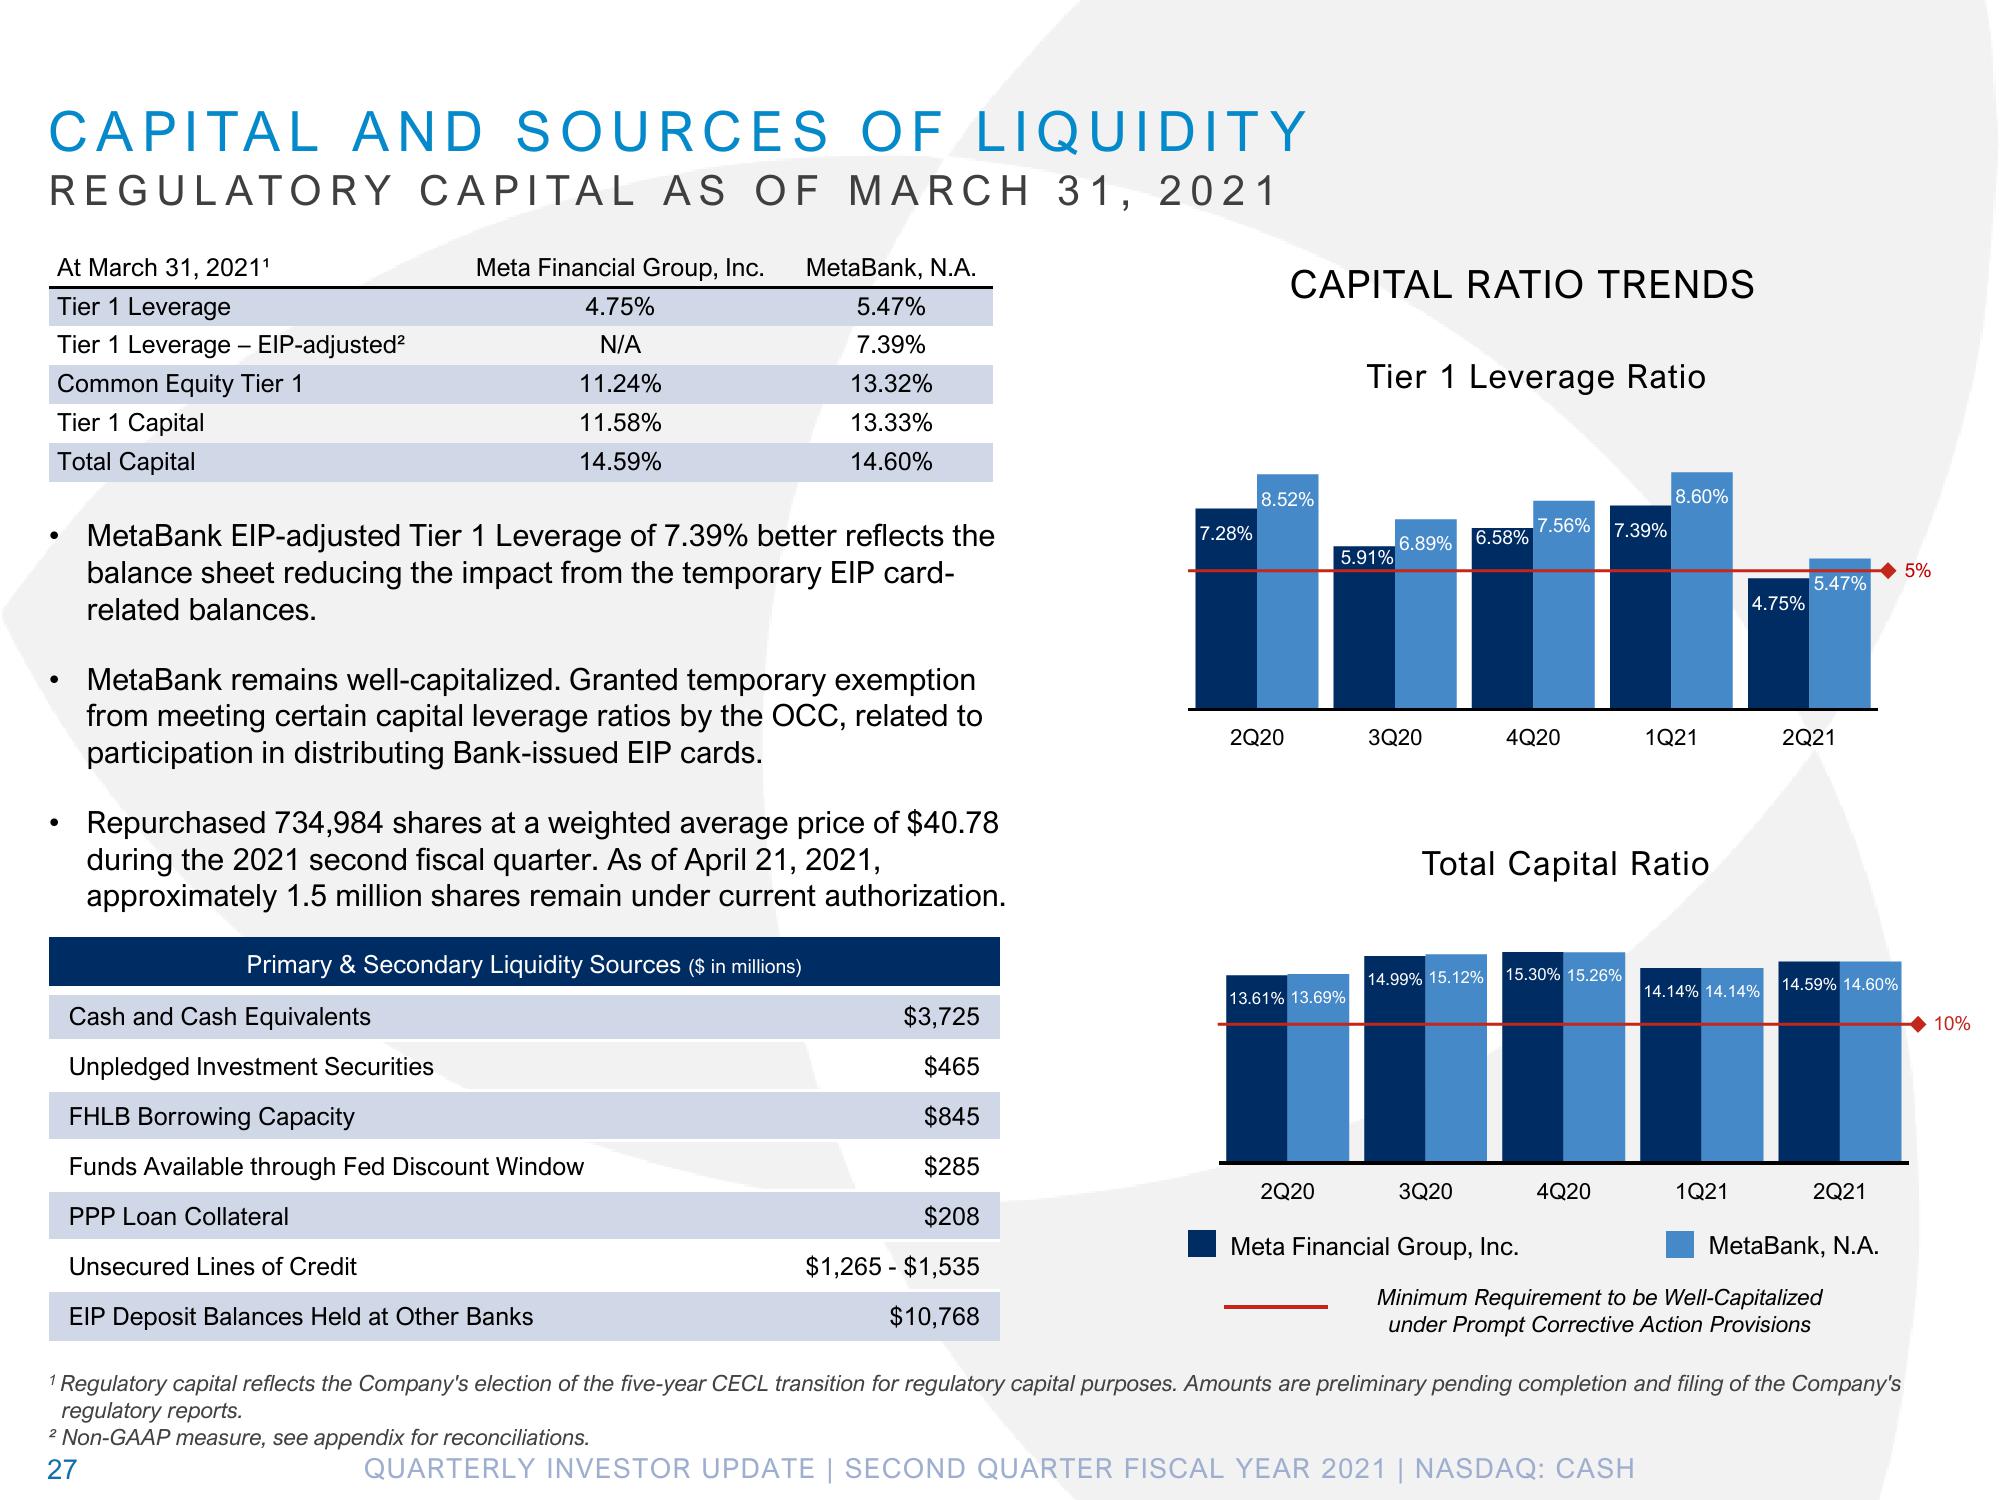
MetaBank EIP-adjusted Tier 1 Leverage of 7.39% better reflects the
balance sheet reducing the impact from the temporary EIP card-
related balances.
MetaBank remains well-capitalized. Granted temporary exemption
from meeting certain capital leverage ratios by the OCC, related to
participation in distributing Bank-issued EIP cards.
Repurchased 734,984 shares at a weighted average price of $40.78
during the 2021 second fiscal quarter. As of April 21, 2021,
approximately 1.5 million shares remain under current authorization.
Primary & Secondary Liquidity Sources ($ in millions)
Cash and Cash Equivalents
Unpledged Investment Securities
FHLB Borrowing Capacity
Funds Available through Fed Discount Window
PPP Loan Collateral
Unsecured Lines of Credit
EIP Deposit Balances Held at Other Banks
$3,725
$465
$845
$285
$208
$1,265 $1,535
$10,768
7.28%
CAPITAL RATIO TRENDS
8.52%
2Q20
13.61% 13.69%
2Q20
Tier 1 Leverage Ratio
5.91%
6.89% 6.58%
3Q20
14.99% 15.12%
3Q20
7.56% 7.39%
4Q20
Total Capital Ratio
15.30% 15.26%
Meta Financial Group, Inc.
4Q20
8.60%
1Q21
QUARTERLY INVESTOR UPDATE | SECOND QUARTER FISCAL YEAR 2021 | NASDAQ: CASH
4.75%
14.14% 14.14%
1Q21
5.47%
2Q21
14.59% 14.60%
2Q21
MetaBank, N.A.
Minimum Requirement to be Well-Capitalized
under Prompt Corrective Action Provisions
Regulatory capital reflects the Company's election of the five-year CECL transition for regulatory capital purposes. Amounts are preliminary pending completion and filing of the Company's
regulatory reports.
² Non-GAAP measure, see appendix for reconciliations.
27
5%
10%View entire presentation