Dragonfly Energy SPAC Presentation Deck
Adj.
EBITDA
Margin
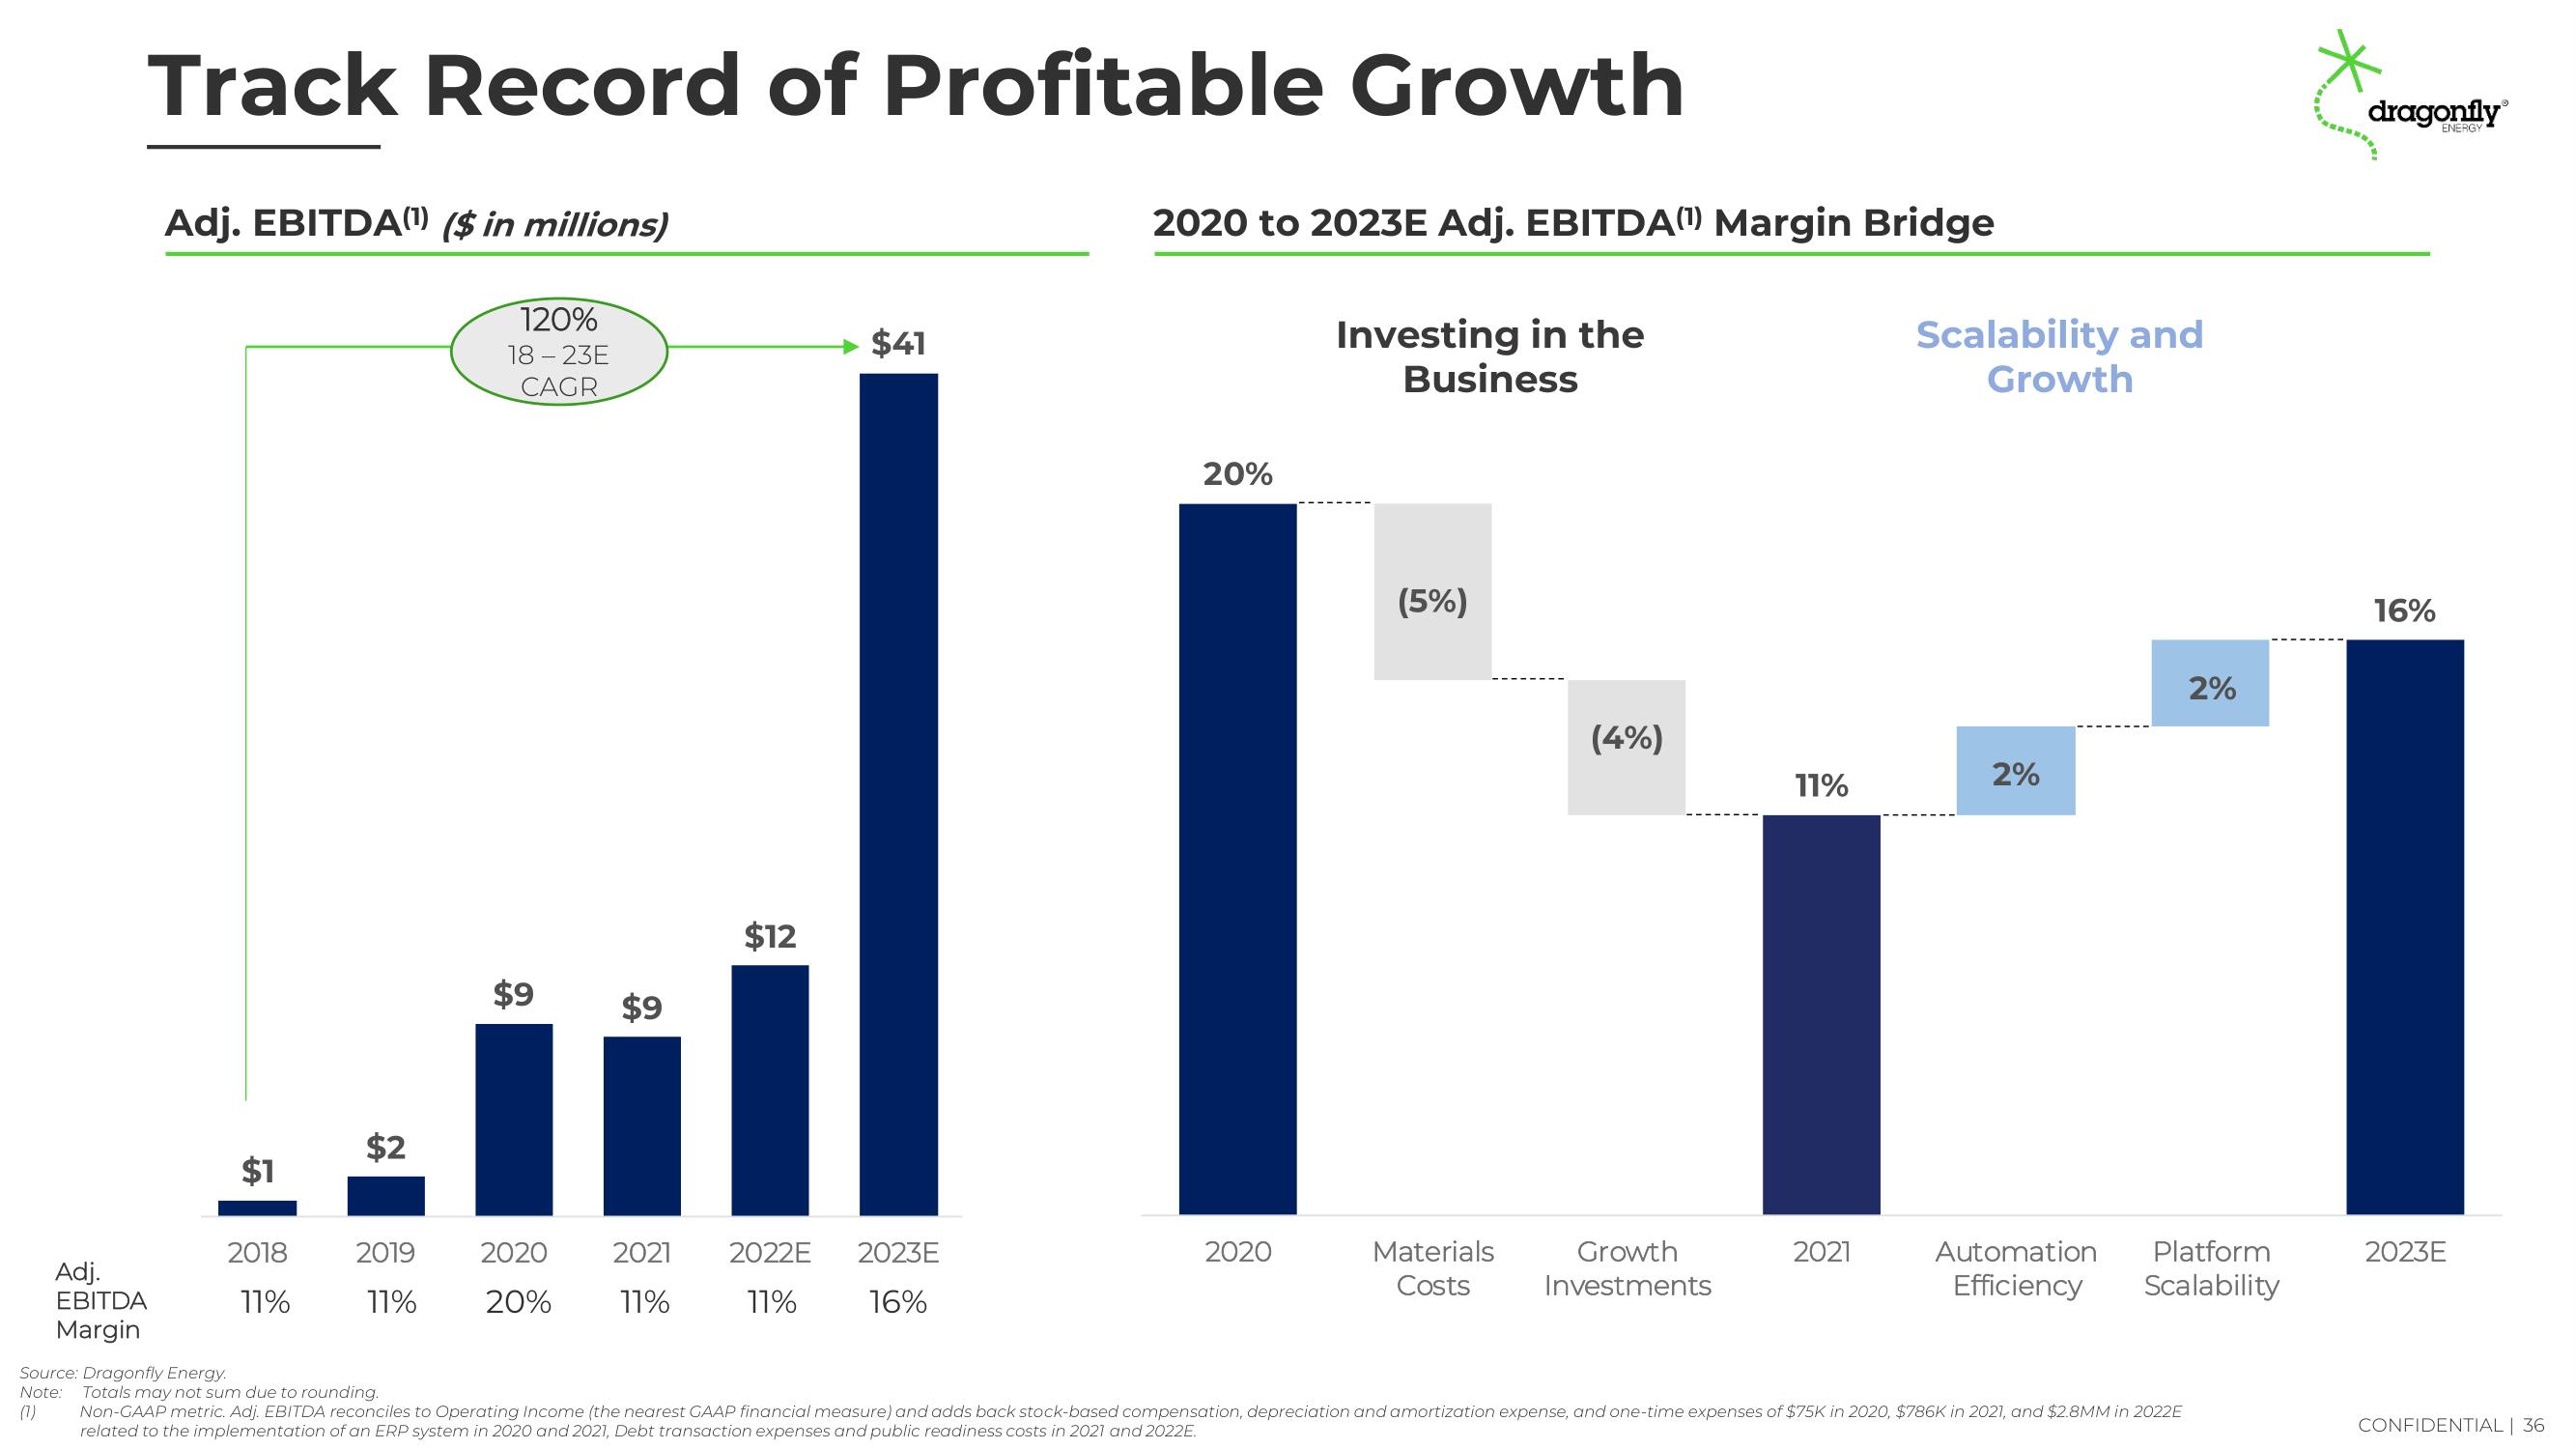
Track Record of Profitable Growth
Adj. EBITDA(¹) ($in millions)
120%
18-23E
CAGR
$1
MI
$12
$9 $9
2018
11%
$2
2019
11%
2020
20%
$41
2021 2022E
11%
11%
2020 to 2023E Adj. EBITDA(¹) Margin Bridge
Investing in the
Business
2023E
16%
20%
2020
(5%)
Materials
Costs
(4%)
Growth
Investments
11%
2021
Scalability and
Growth
2%
Automation
Efficiency
2%
Platform
Scalability
Source: Dragonfly Energy.
Note:
(7)
Totals may not sum due to rounding.
Non-GAAP metric. Adj. EBITDA reconciles to Operating Income (the nearest GAAP financial measure) and adds back stock-based compensation, depreciation and amortization expense, and one-time expenses of $75K in 2020, $786K in 2021, and $2.8MM in 2022E
related to the implementation of an ERP system in 2020 and 2021, Debt transaction expenses and public readiness costs in 2021 and 2022E.
dragonfly
ENERGY
16%
2023E
CONFIDENTIAL | 36View entire presentation