Opendoor Investor Presentation Deck
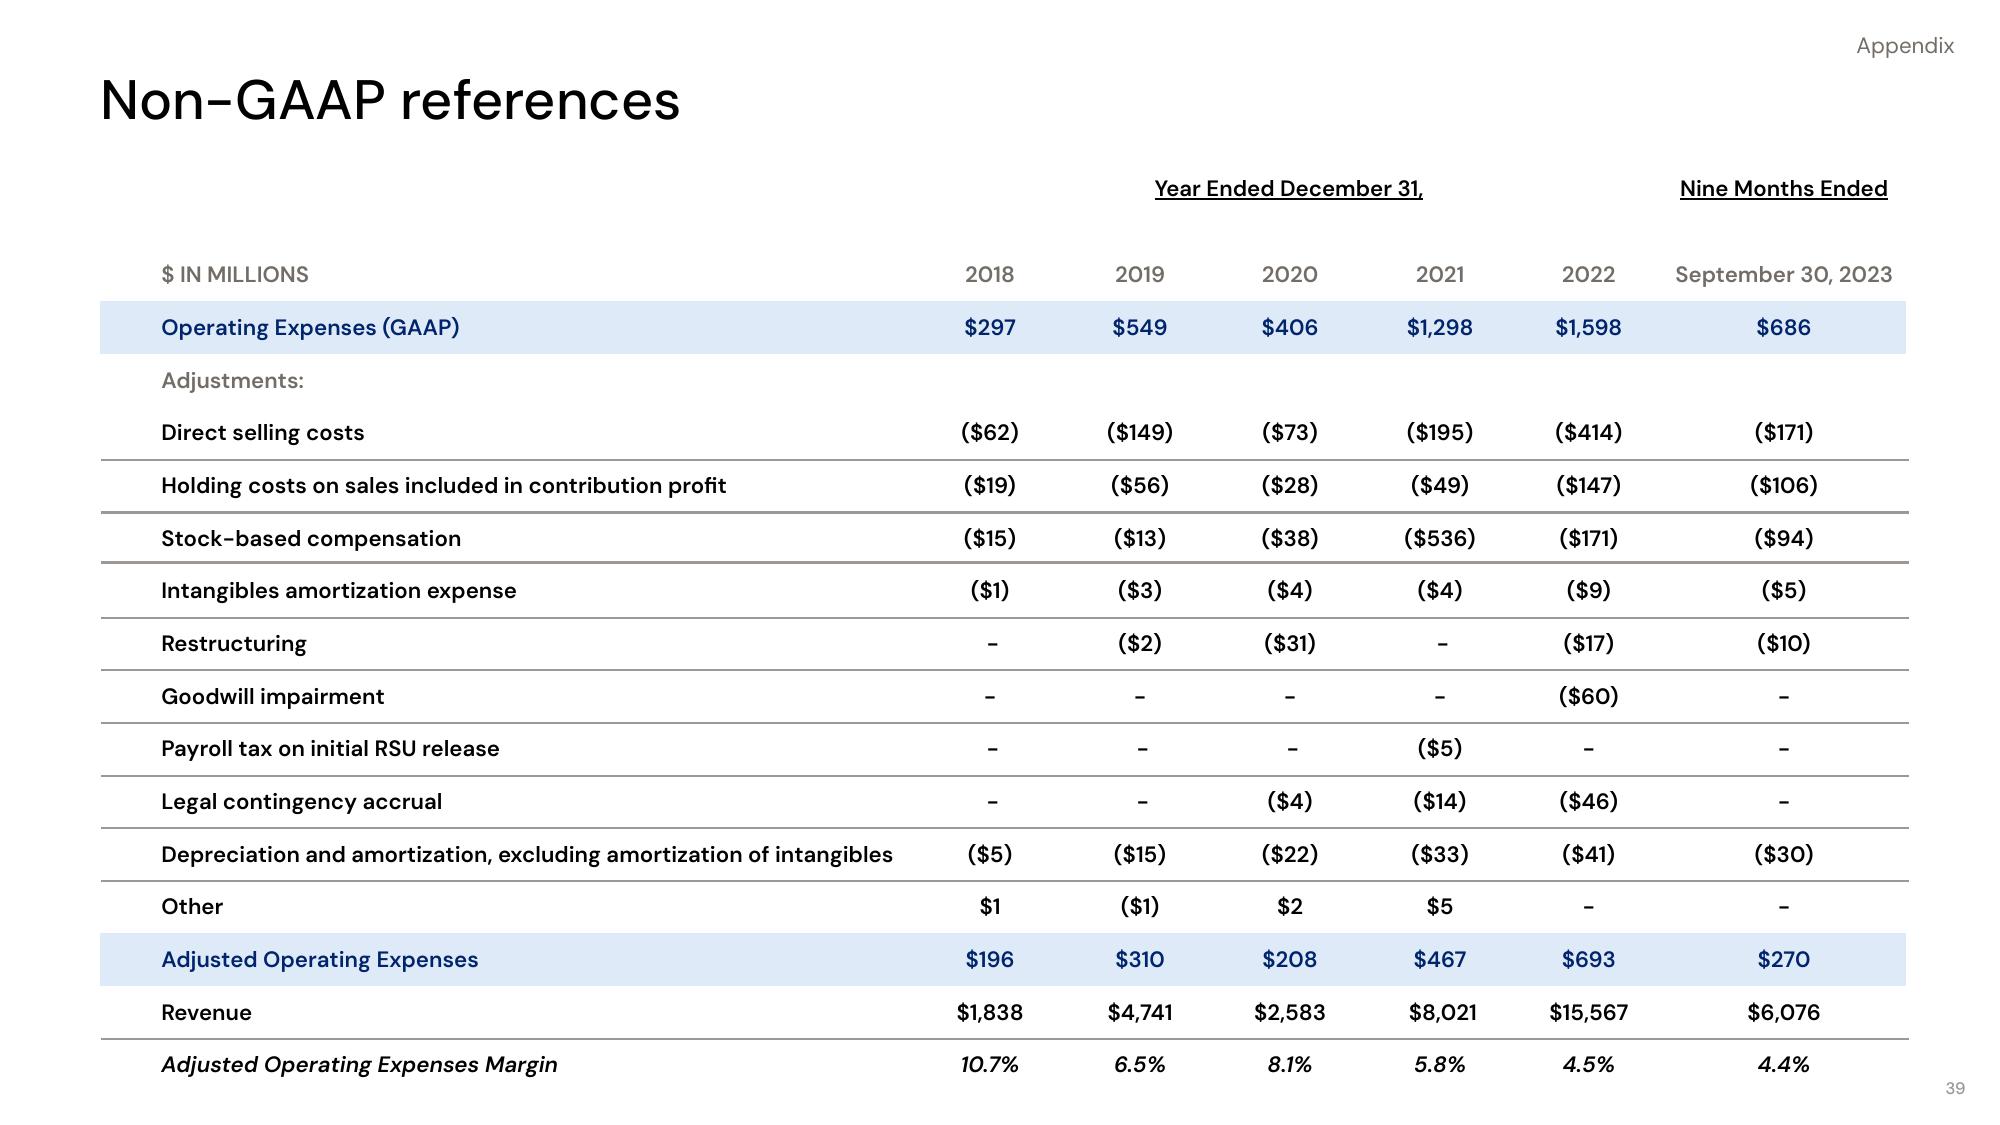
Non-GAAP references
$ IN MILLIONS
Operating Expenses (GAAP)
Adjustments:
Direct selling costs
Holding costs on sales included in contribution profit
Stock-based compensation
Intangibles amortization expense
Restructuring
Goodwill impairment
Payroll tax on initial RSU release
Legal contingency accrual
Depreciation and amortization, excluding amortization of intangibles
Other
Adjusted Operating Expenses
Revenue
Adjusted Operating Expenses Margin
2018
$297
($62)
($19)
($15)
($1)
($5)
$1
$196
$1,838
10.7%
Year Ended December 31,
2019
$549
($149)
($56)
($13)
($3)
($2)
($15)
($1)
$310
$4,741
6.5%
2020
$406
($73)
($28)
($38)
($4)
($31)
($4)
($22)
$2
$208
$2,583
8.1%
2021
$1,298
($195)
($49)
($536)
($4)
($5)
($14)
($33)
$5
$467
$8,021
5.8%
2022
$1,598
($414)
($147)
($171)
($9)
($17)
($60)
($46)
($41)
$693
$15,567
4.5%
Nine Months Ended
September 30, 2023
$686
($171)
($106)
($94)
($5)
($10)
($30)
Appendix
$270
$6,076
4.4%
39View entire presentation