Melrose Results Presentation Deck
Cash generation in the year
Melrose
Free cash flow
Cash flow from continuing operations
£m
Adjusted operating cash flow (pre capex)¹
Net capital expenditure
Net interest and tax paid
Defined benefit pension contributions - ongoing annual contributions
Dividend income from equity accounted investments
Trading net other
Adjusted free cash flow 1
Defined benefit pension - special contributions²
Restructuring
Free cash flow 1
■
■
I
■
Buy
Improve
Sell
1.
2.
Group
2019
1,441
3.
4.
(495)
(295)
(72)
67
(55)
591
(111)
(190)
290
Reconciliation of opening to closing net debt
Reconciliation of net debt
£m
Net debt brought forward
Net cash flow from disposals and acquisition related activities 4
Discontinued operations
Free cash inflow in the period
Dividend paid to shareholders
Foreign exchange and other
Net debt¹ at 31 December 2019
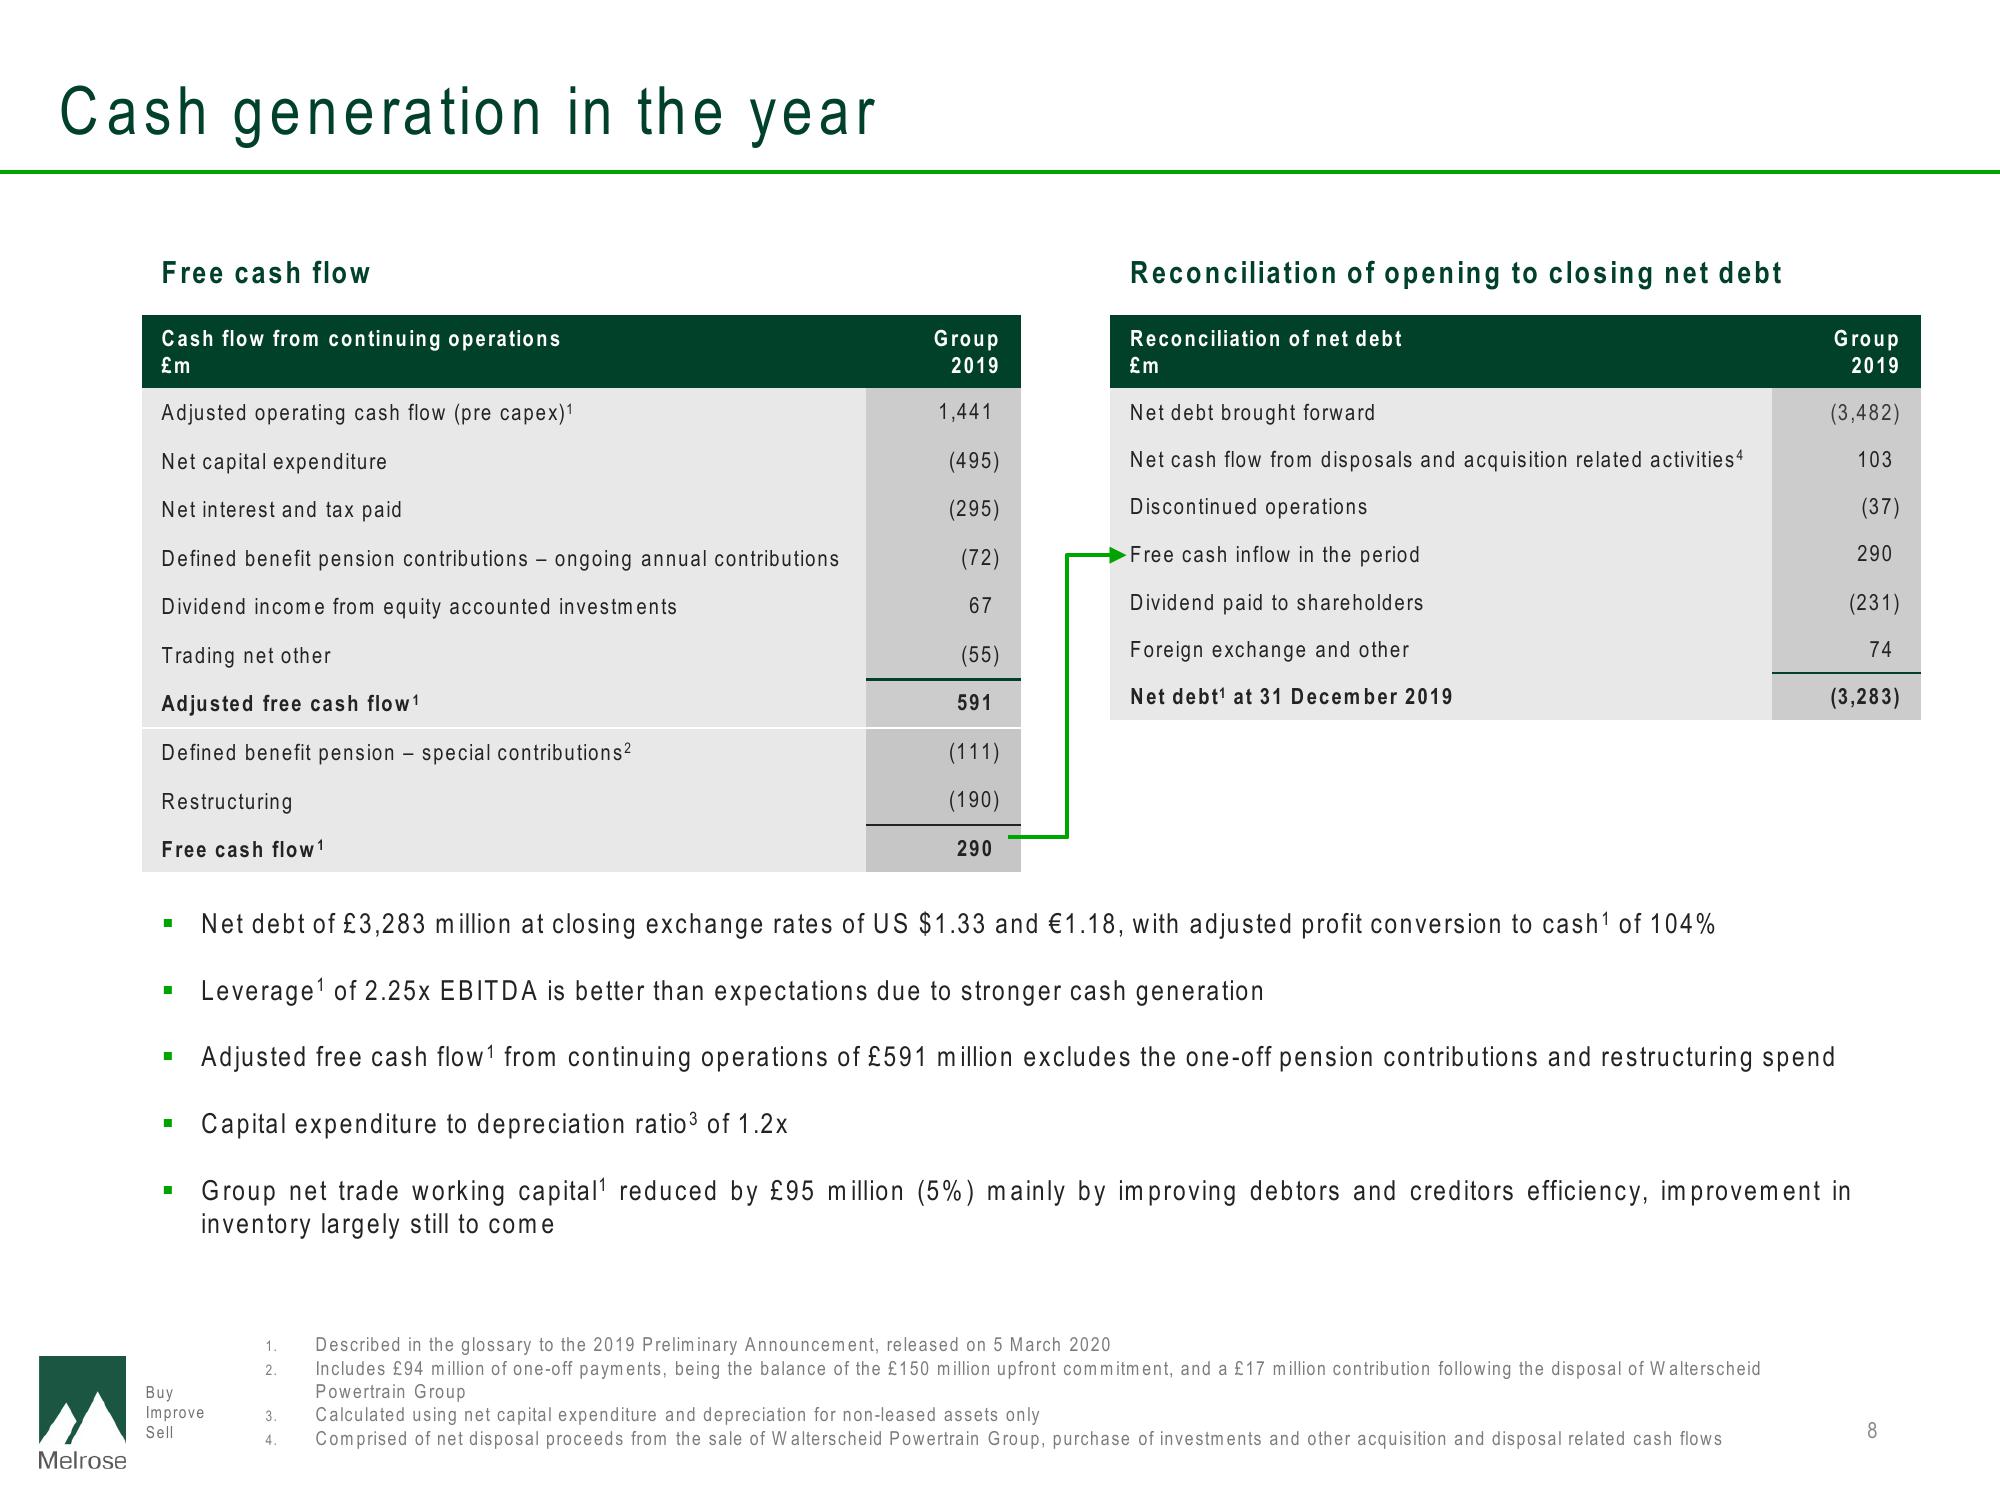
Net debt of £3,283 million at closing exchange rates of US $1.33 and €1.18, with adjusted profit conversion to cash¹ of 104%
Leverage ¹ of 2.25x EBITDA is better than expectations due to stronger cash generation
Adjusted free cash flow¹ from continuing operations of £591 million excludes the one-off pension contributions and restructuring spend
Capital expenditure to depreciation ratio³ of 1.2x
Group net trade working capital¹ reduced by £95 million (5%) mainly by improving debtors and creditors efficiency, improvement in
inventory largely still to come
Group
2019
Described in the glossary to the 2019 Preliminary Announcement, released on 5 March 2020
Includes £94 million of one-off payments, being the balance of the £150 million upfront commitment, and a £17 million contribution following the disposal of Walterscheid
Powertrain Group
Calculated using net capital expenditure and depreciation for non-leased assets only
Comprised of net disposal proceeds from the sale of Walterscheid Powertrain Group, purchase of investments and other acquisition and disposal related cash flows
(3,482)
103
(37)
290
(231)
74
(3,283)
8View entire presentation