Samsara Investor Presentation Deck
31
Samsara Inc. Confidential.
samsara
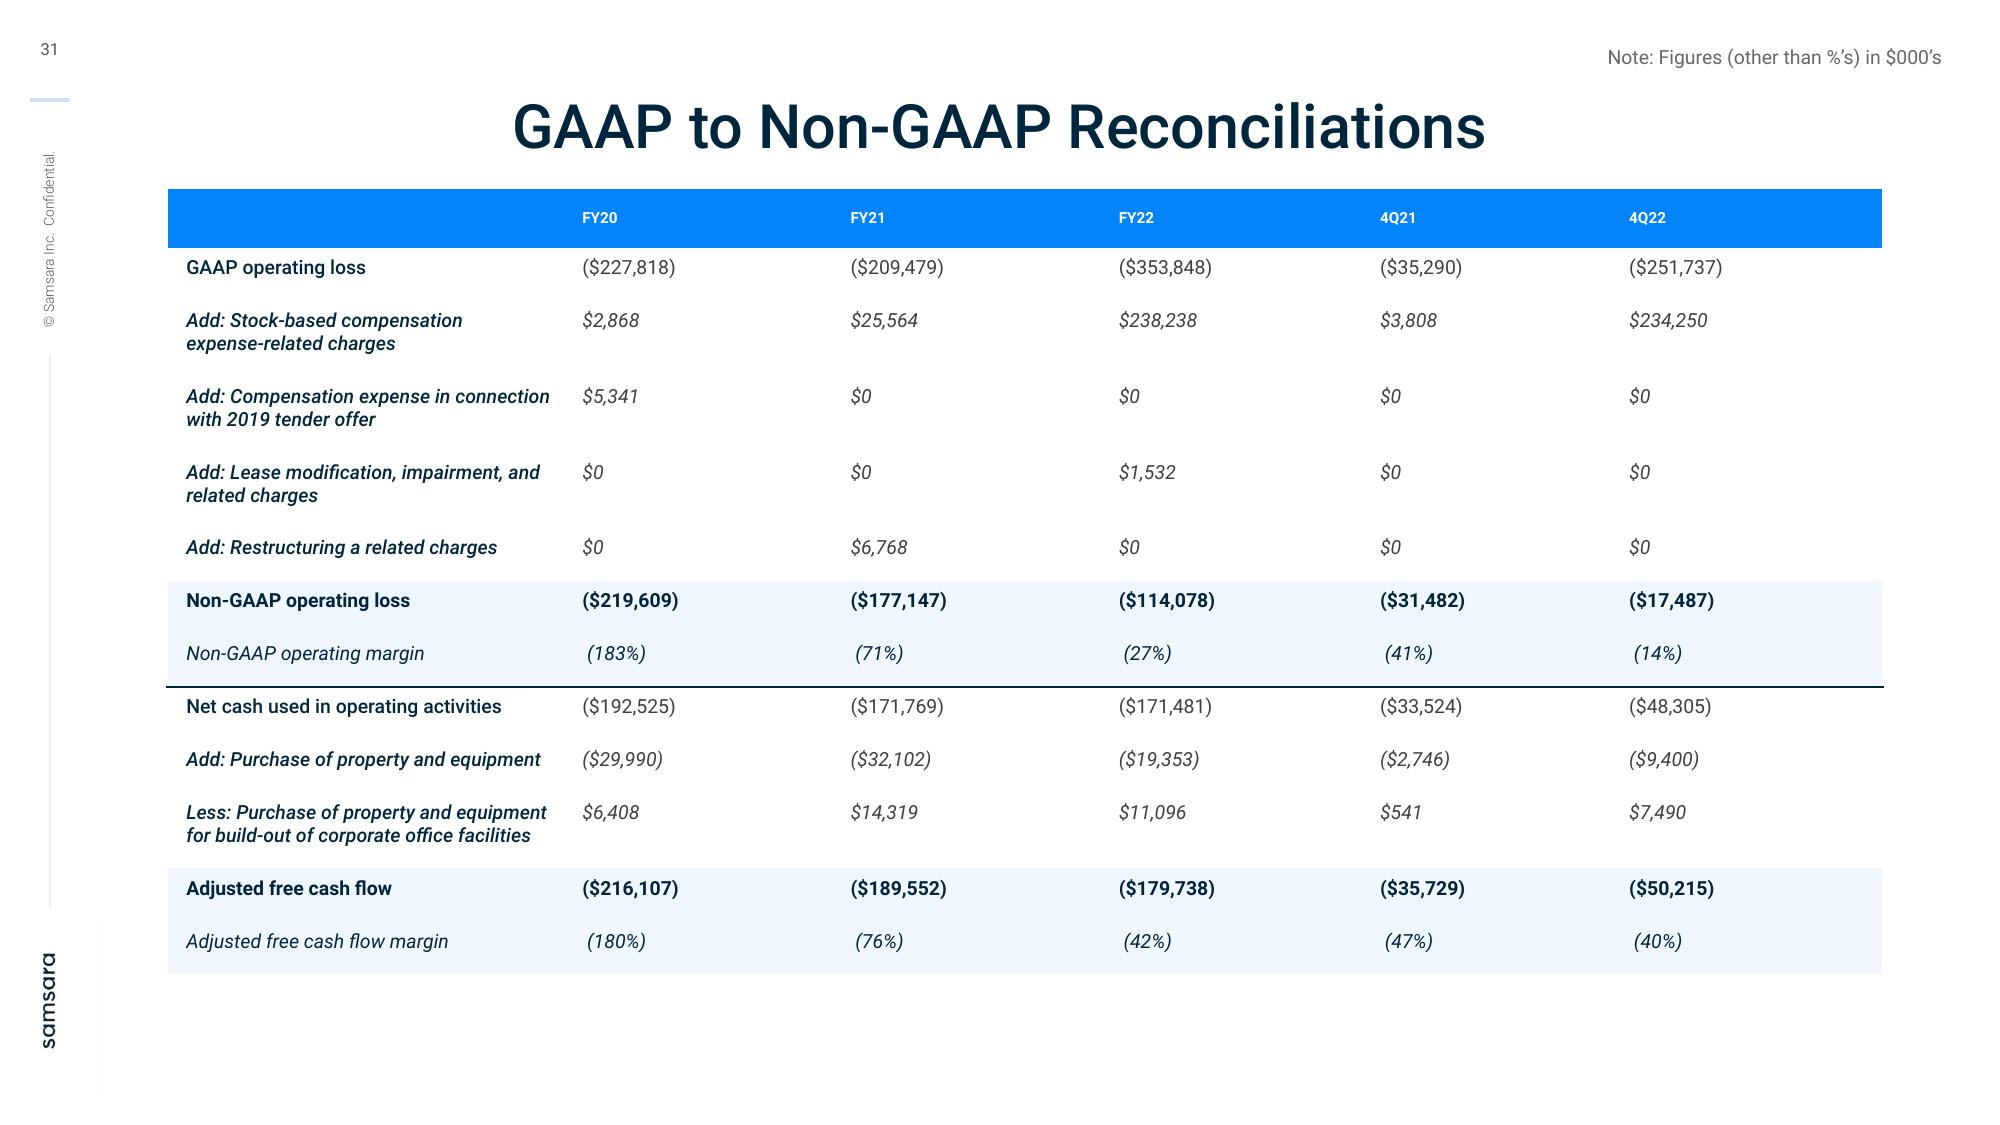
GAAP operating loss
Add: Stock-based compensation
expense-related charges
GAAP to Non-GAAP Reconciliations
Add: Compensation expense in connection
with 2019 tender offer
Add: Lease modification, impairment, and
related charges
Add: Restructuring a related charges
Non-GAAP operating loss
Non-GAAP operating margin
Net cash used in operating activities
Add: Purchase of property and equipment
Less: Purchase of property and equipment
for build-out of corporate office facilities
Adjusted free cash flow
Adjusted free cash flow margin
FY20
($227,818)
$2,868
$5,341
$0
$0
($219,609)
(183%)
($192,525)
($29,990)
$6,408
($216,107)
(180%)
FY21
($209,479)
$25,564
$0
$0
$6,768
($177,147)
(71%)
($171,769)
($32,102)
$14,319
($189,552)
(76%)
FY22
($353,848)
$238,238
$0
$1,532
$0
($114,078)
(27%)
($171,481)
($19,353)
$11,096
($179,738)
(42%)
4Q21
($35,290)
$3,808
$0
8
$0
$0
($31,482)
(41%)
($33,524)
($2,746)
$541
($35,729)
(47%)
Note: Figures (other than %'s) in $000's
4Q22
($251,737)
$234,250
$0
$0
$0
($17,487)
(14%)
($48,305)
($9,400)
$7,490
($50,215)
(40%)View entire presentation