J.P.Morgan Results Presentation Deck
JPMORGAN CHASE & CO.
CONSUMER & COMMUNITY BANKING
FINANCIAL HIGHLIGHTS
(in millions, except ratio data)
INCOME STATEMENT
REVENUE
Lending- and deposit-related fees
Asset management, administration and commissions
Mortgage fees and related income
Card income
All other income
Noninterest revenue
Net interest income
TOTAL NET REVENUE
Provision for credit losses
NONINTEREST EXPENSE
Compensation expense
Noncompensation expense (a)
TOTAL NONINTEREST EXPENSE
Income before income tax expense
Income tax expense (b)
NET INCOME (b)
REVENUE BY LINE OF BUSINESS
Consumer & Business Banking
Home Lending
Card & Auto
MORTGAGE FEES AND RELATED INCOME DETAILS
Production revenue
Net mortgage servicing revenue (c)
Mortgage fees and related income
FINANCIAL RATIOS
ROE
Overhead ratio
$
$
$
$
3Q22
822
939
313
665
1,023
3,762
10,569
14,331
529
3,345
4,702
8,047
5,755
1,421
4,334
8,010
920
5,401
93
220
313
33%
56
$
$
2Q22
$
855
947
377
678
1,049
3,906
8,708
12,614
761
3,237
4,486
7,723
4,130
1,030
3,100
$ 6,558
1,001
5,055
150
227
377
24 %
61
$
$
1Q22
$
805
929
456
590
1,122
3,902
8,327
12,229
678
3,831
936
$ 2,895
3,171
4,549
7,720
6,062
1,169
4,998
211
245
456
QUARTERLY TRENDS
23 %
63
$
4Q21
$
753
950
312
675
1,144
3,834
8,441
12,275
(1,060)
3,177
4,577
7,754
5,581
1,434
$ 4,147
6,172
1,084
5,019
327
(15)
312
32% (b)
63
$
$
$
$
3Q21
786
893
596
651
1,212
4,138
8,383
12,521
(459)
3,012
4,226
7,238
5,742
1,391
4,351
6,157
1,400
4,964
614
(18)
596
34%
58
3Q22 Change
2Q22
(4)%
(1)
(17)
(2)
(2)
(4)
21
14
(30)
3
5
4
39
38
40
22
(8)
7
(38)
(3)
(17)
JPMORGAN CHASE & Co.
3Q21
5%
5
(47)
2
(16)
(9)
26
14
NM
11
11
11
| N |
30
(34)
9
(85)
NM
(47)
$
$
$
$
NINE MONTHS ENDED SEPTEMBER 30,
2022
2,482
2,815
1,146
1,933
3,194
11,570
27,604
39,174
1,968
9,753
13,737
23,490
13,716
3,387
10,329
20,630
3,090
15,454
454
692
1,146
27
60
%
$
$
$
$
2021
2,281
2,564
1,847
2,888
3,872
13,452
24,346
37,798
(5,929)
8,965
12,537
21,502
22,225
5,442
16,783
17,808
4,207
15,783
1,888
(41)
1,847
44 %
57
2022 Change
2021
9%
10
(38)
(33)
(18)
(14)
13
4
NM
9
10
9
(38)
(38)
(38)
16
(27)
(2)
(76)
NM
(38)
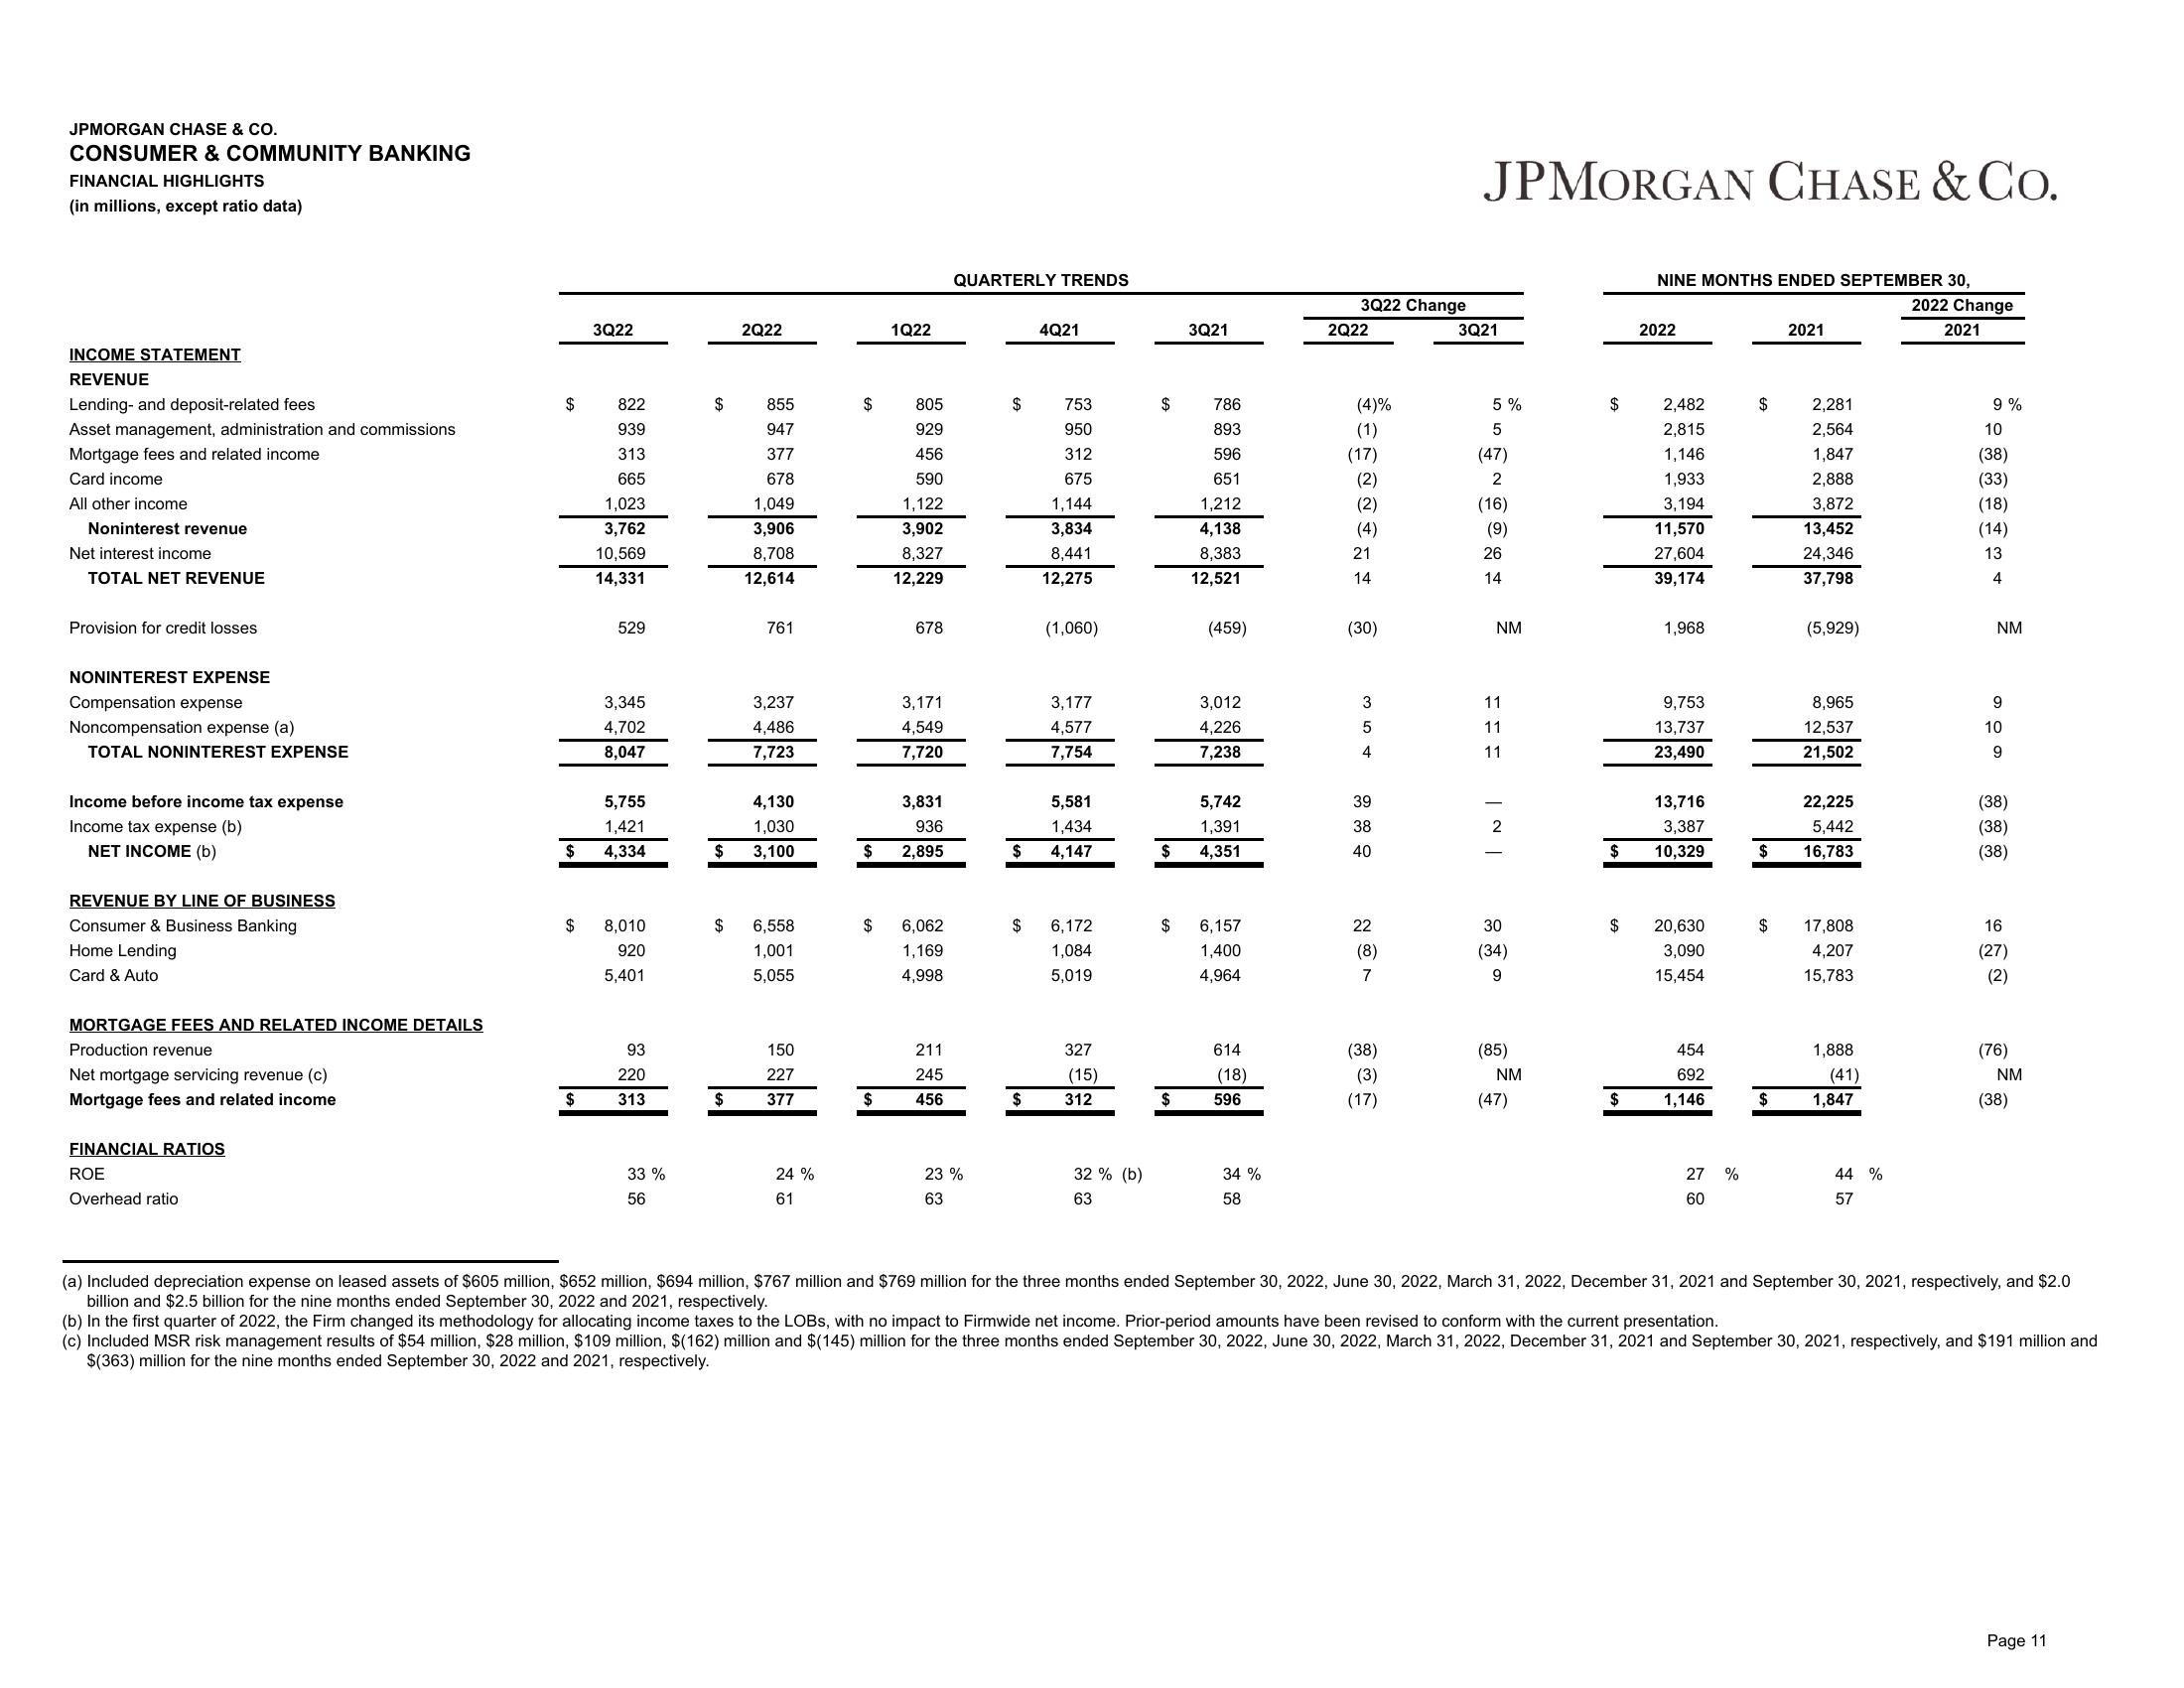
(a) Included depreciation expense on leased assets of $605 million, $652 million, $694 million, $767 million and $769 million for the three months ended September 30, 2022, June 30, 2022, March 31, 2022, December 31, 2021 and September 30, 2021, respectively, and $2.0
billion and $2.5 billion for the nine months ended September 30, 2022 and 2021, respectively.
(b) In the first quarter of 2022, the Firm changed its methodology for allocating income taxes to the LOBS, with no impact to Firmwide net income. Prior-period amounts have been revised to conform with the current presentation.
(c) Included MSR risk management results of $54 million, $28 million, $109 million, $(162) million and $(145) million for the three months ended September 30, 2022, June 30, 2022, March 31, 2022, December 31, 2021 and September 30, 2021, respectively, and $191 million and
$(363) million for the nine months ended September 30, 2022 and 2021, respectively.
Page 11View entire presentation