Stem SPAC Presentation Deck
stem Financial Forecast
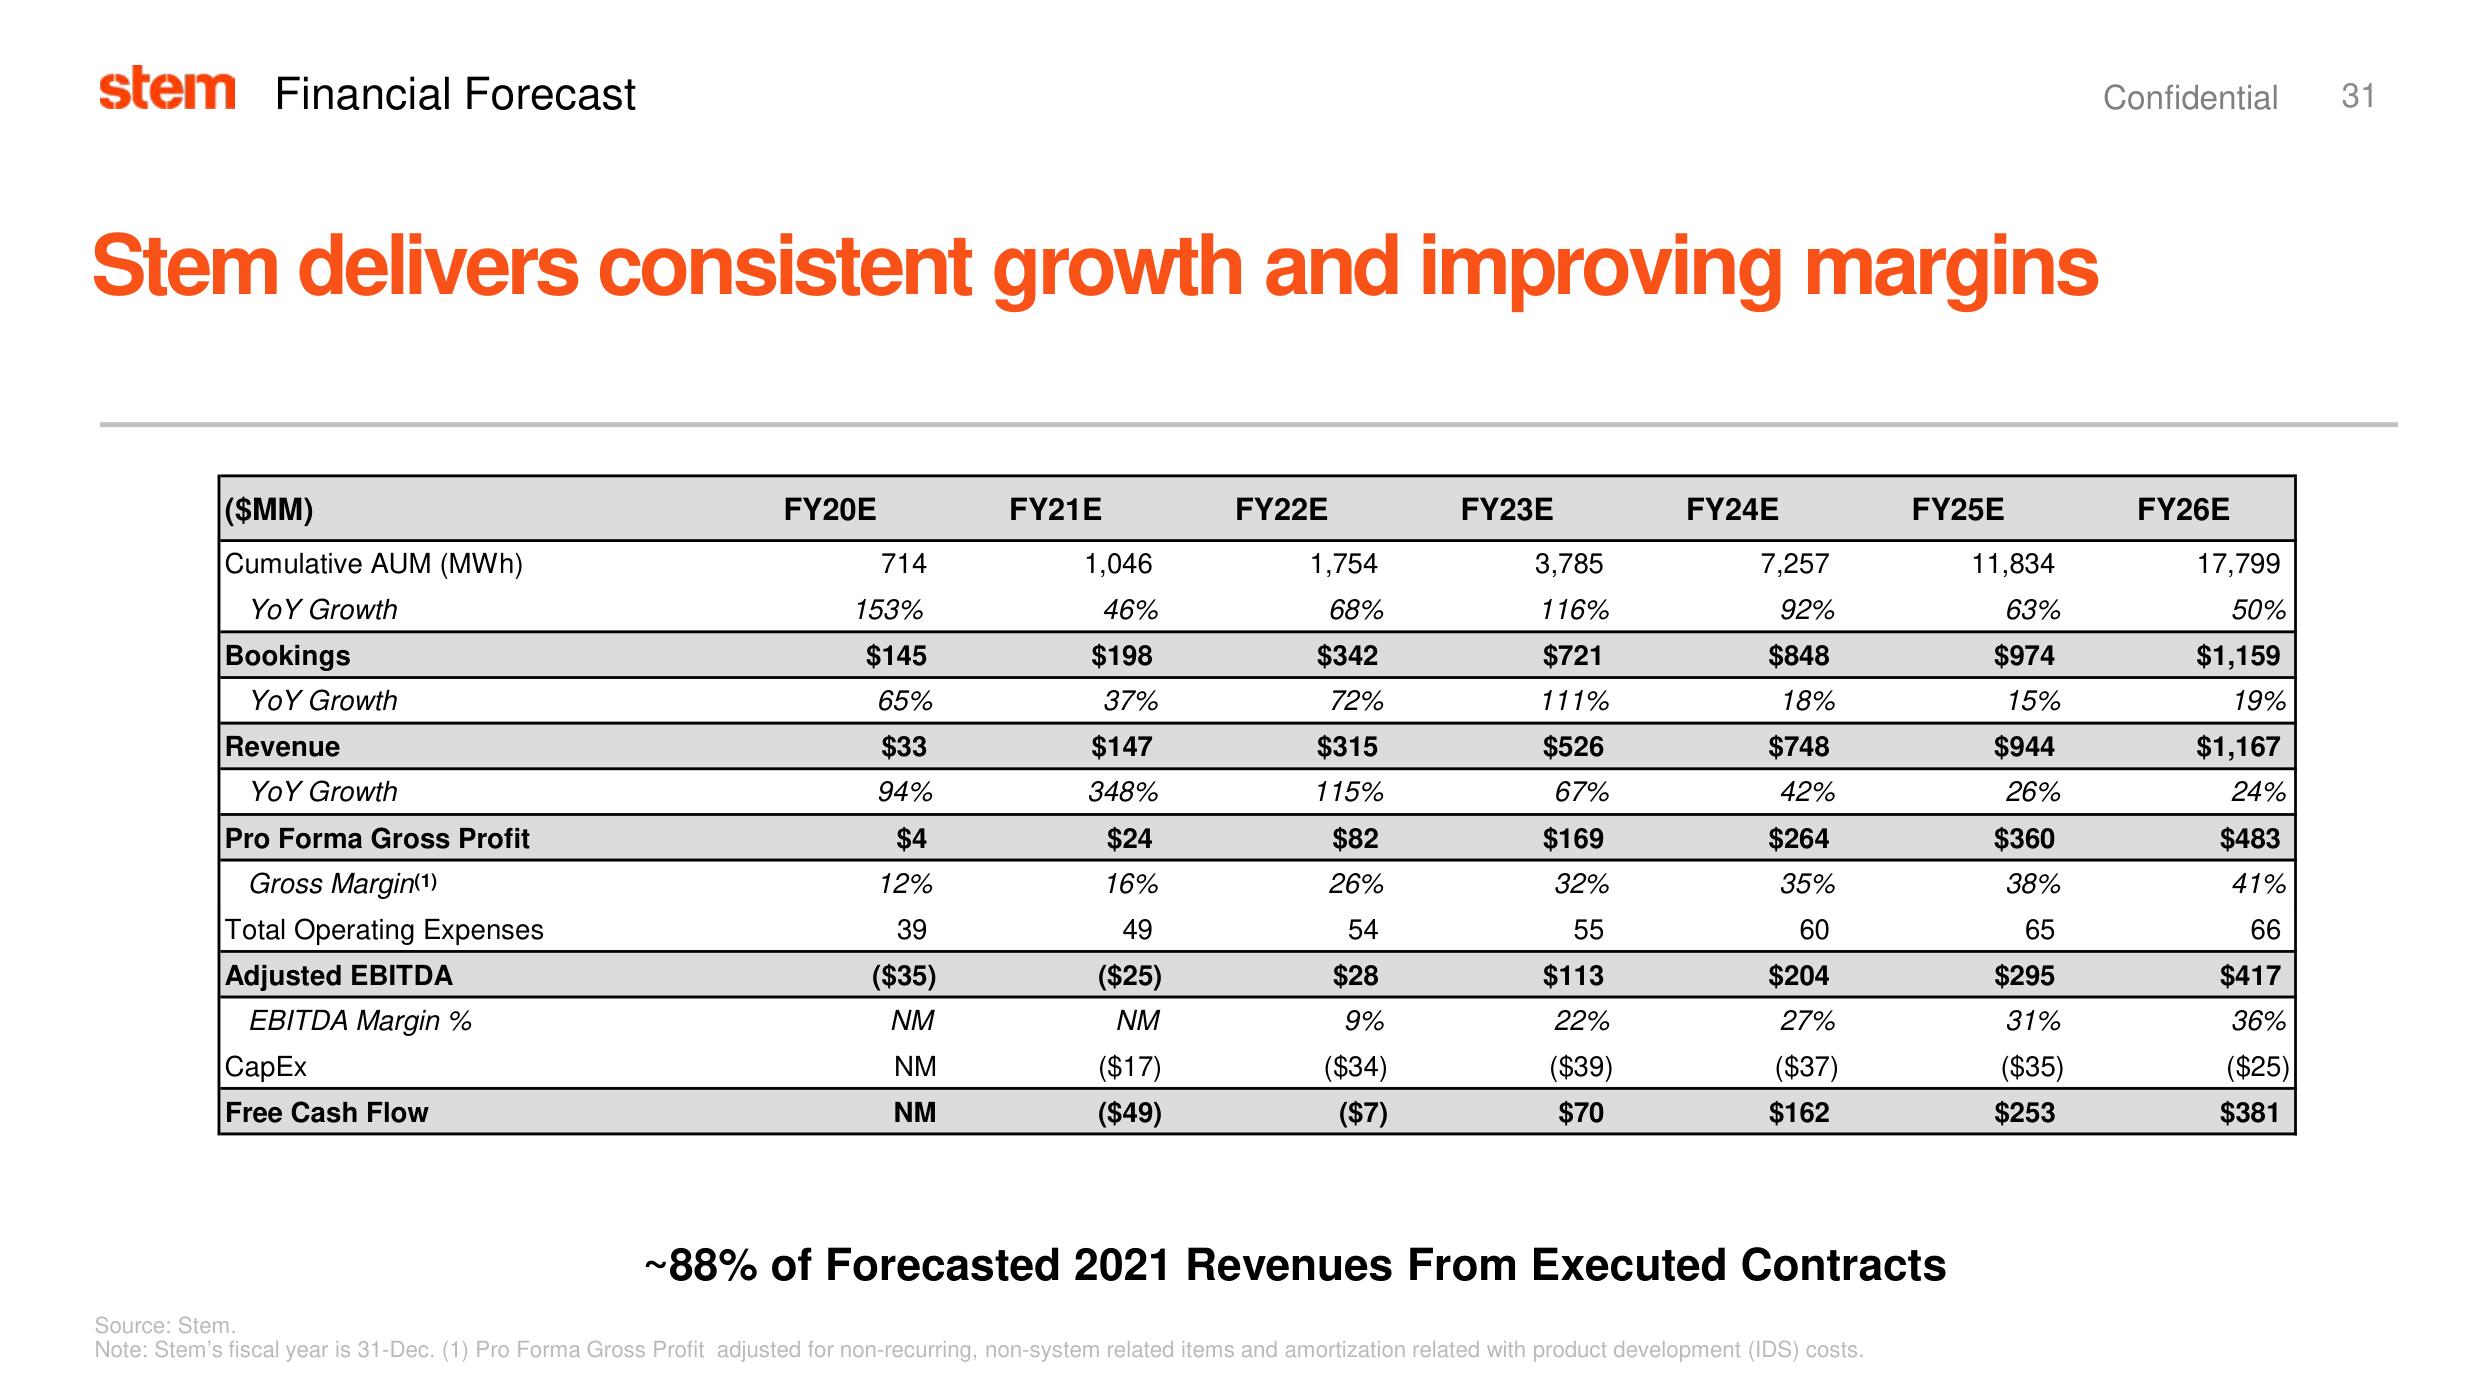
Stem delivers consistent growth and improving margins
($MM)
Cumulative AUM (MWh)
Yo Y Growth
Bookings
YOY Growth
Revenue
YOY Growth
Pro Forma Gross Profit
Gross Margin(1)
Total Operating Expenses
Adjusted EBITDA
EBITDA Margin %
CapEx
Free Cash Flow
FY20E
714
153%
$145
65%
$33
94%
$4
12%
39
($35)
NM
NM
NM
FY21E
1,046
46%
$198
37%
$147
348%
$24
16%
49
($25)
NM
($17)
($49)
FY22E
1,754
68%
$342
72%
$315
115%
$82
26%
54
$28
9%
($34)
($7)
FY23E
3,785
116%
$721
111%
$526
67%
$169
32%
55
$113
22%
($39)
$70
FY24E
7,257
92%
$848
18%
$748
42%
$264
35%
60
$204
27%
($37)
$162
FY25E
~88% of Forecasted 2021 Revenues From Executed Contracts
Source: Stem.
Note: Stem's fiscal year is 31-Dec. (1) Pro Forma Gross Profit adjusted for non-recurring, non-system related items and amortization related with product development (IDS) costs.
11,834
63%
$974
15%
$944
26%
$360
38%
65
$295
31%
($35)
$253
Confidential 31
FY26E
17,799
50%
$1,159
19%
$1,167
24%
$483
41%
66
$417
36%
($25)
$381View entire presentation