Freshworks Investor Day Presentation Deck
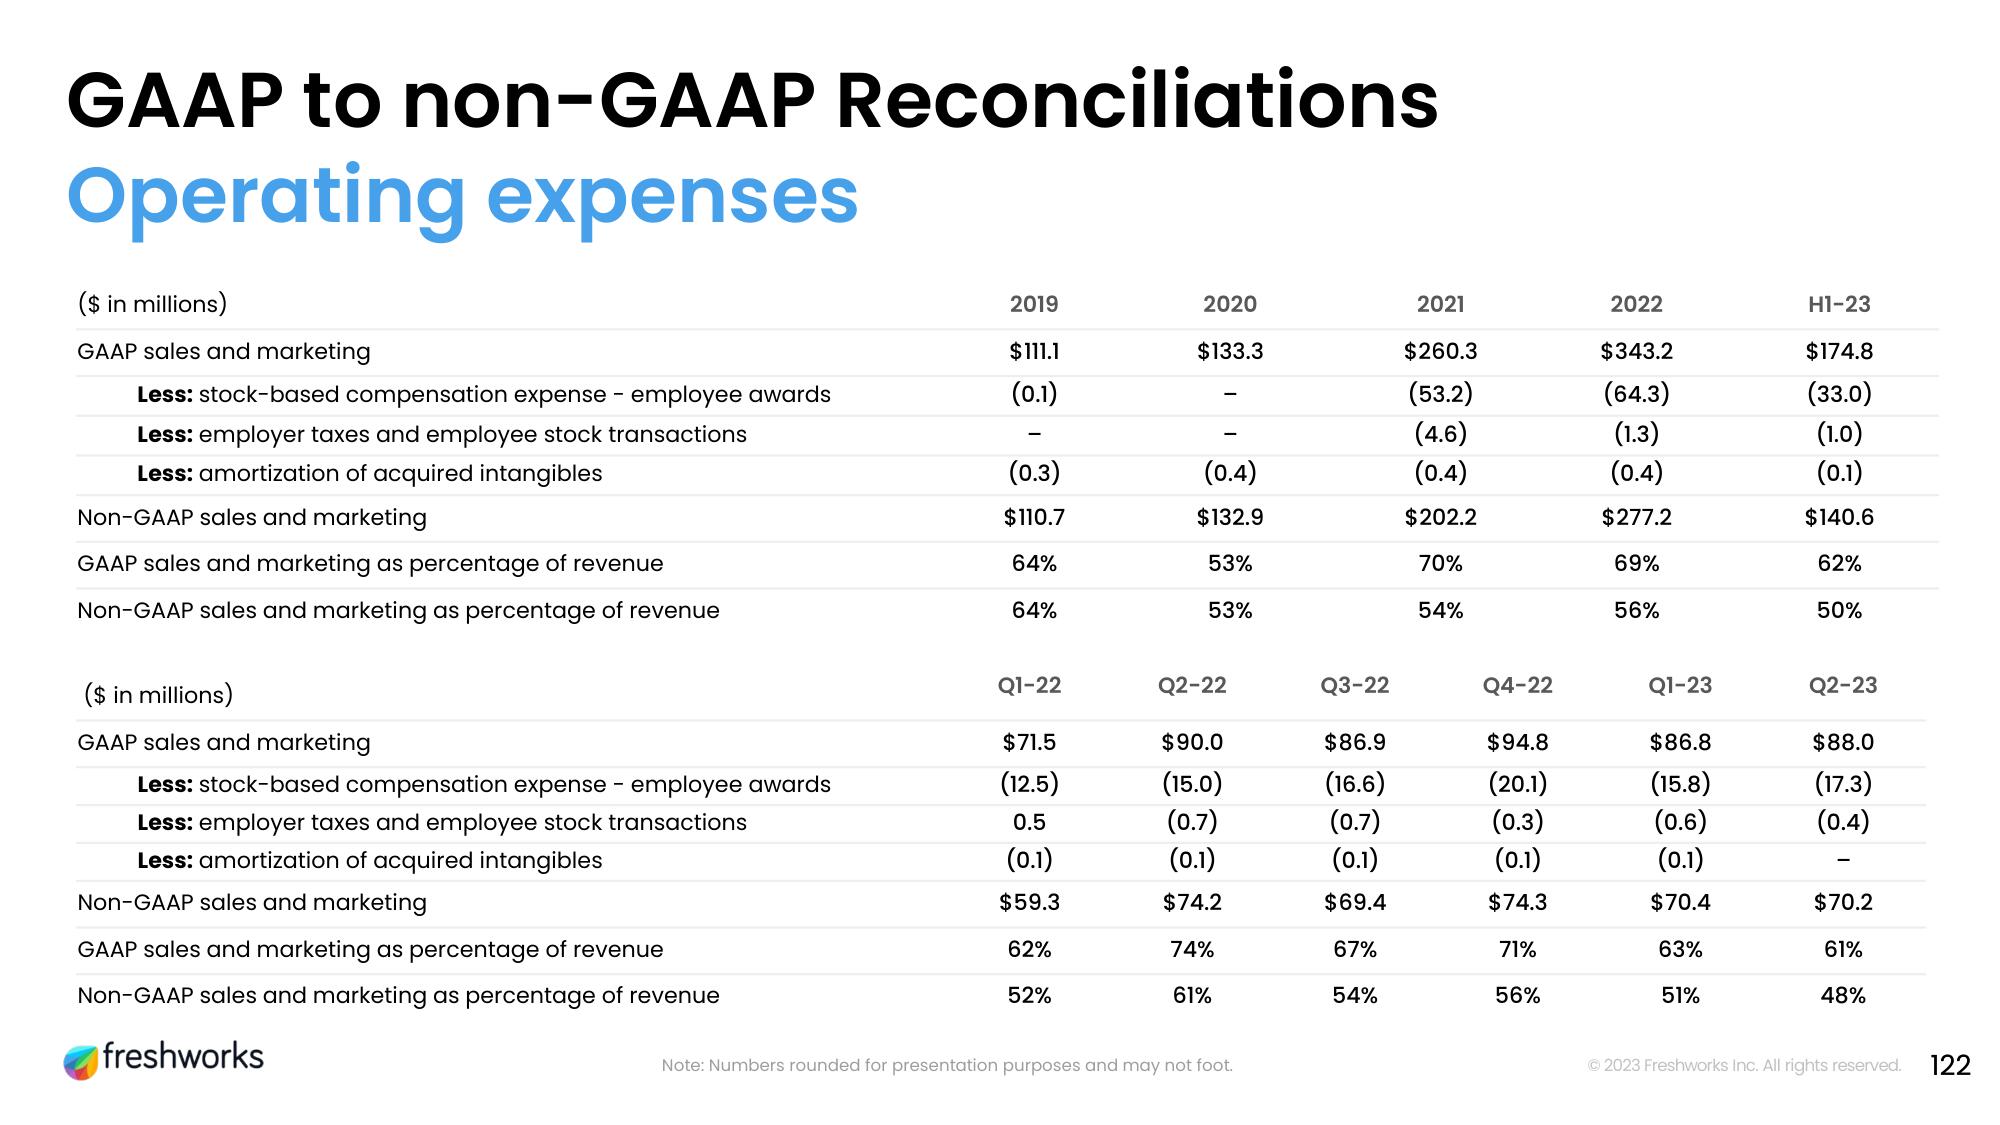
GAAP to non-GAAP Reconciliations
Operating expenses
($ in millions)
GAAP sales and marketing
Less: stock-based compensation expense - employee awards
Less: employer taxes and employee stock transactions
Less: amortization of acquired intangibles
Non-GAAP sales and marketing
GAAP sales and marketing as percentage of revenue
Non-GAAP sales and marketing as percentage of revenue
freshworks
2019
$111.1
(0.1)
(0.3)
$110.7
64%
64%
Q1-22
$71.5
(12.5)
0.5
(0.1)
$59.3
62%
52%
2020
$133.3
(0.4)
$132.9
53%
53%
Q2-22
$90.0
(15.0)
(0.7)
(0.1)
$74.2
74%
61%
Note: Numbers rounded for presentation purposes and may not foot.
Q3-22
$86.9
(16.6)
(0.7)
(0.1)
$69.4
67%
54%
2021
$260.3
(53.2)
(4.6)
(0.4)
$202.2
70%
54%
Q4-22
$94.8
(20.1)
(0.3)
(0.1)
$74.3
71%
56%
2022
$343.2
(64.3)
(1.3)
(0.4)
$277.2
69%
56%
Q1-23
$86.8
(15.8)
(0.6)
(0.1)
$70.4
63%
51%
H1-23
$174.8
(33.0)
(1.0)
(0.1)
$140.6
62%
50%
Q2-23
$88.0
(17.3)
(0.4)
$70.2
61%
48%
Ⓒ2023 Freshworks Inc. All rights reserved. 122View entire presentation