Q1 2023 Earnings Presentation
Q1 2023 YEAR-OVER-YEAR COMPARISON
Q1 2023 Non-GAAP Financial Performance
[$M, except EPS]
Revenues
Operating Income
Operating Margin (%)
EPS
Free Cash Flow
[$M]
Cash, Equivalents &
Short-term Investments
Net (Debt)/ Cash
WC-to-revenue ratio*
Q1 2023
$685.3
$139.4
2023 Bruker
20.3%
$0.64
$62.5
Mar 31,
2023
$597.9
($632.8)
$0.43
Q1 2022
$595.0
$115.8
19.5%
$0.49
$58.8
Dec 31,
2022
$645.5
($575.4)
$0.43
A
+15.2%
+20.4%
+80 bps
+30.6%
+$3.7
A
-7.4%
+10.0%
flat
Comments (year-over-year)
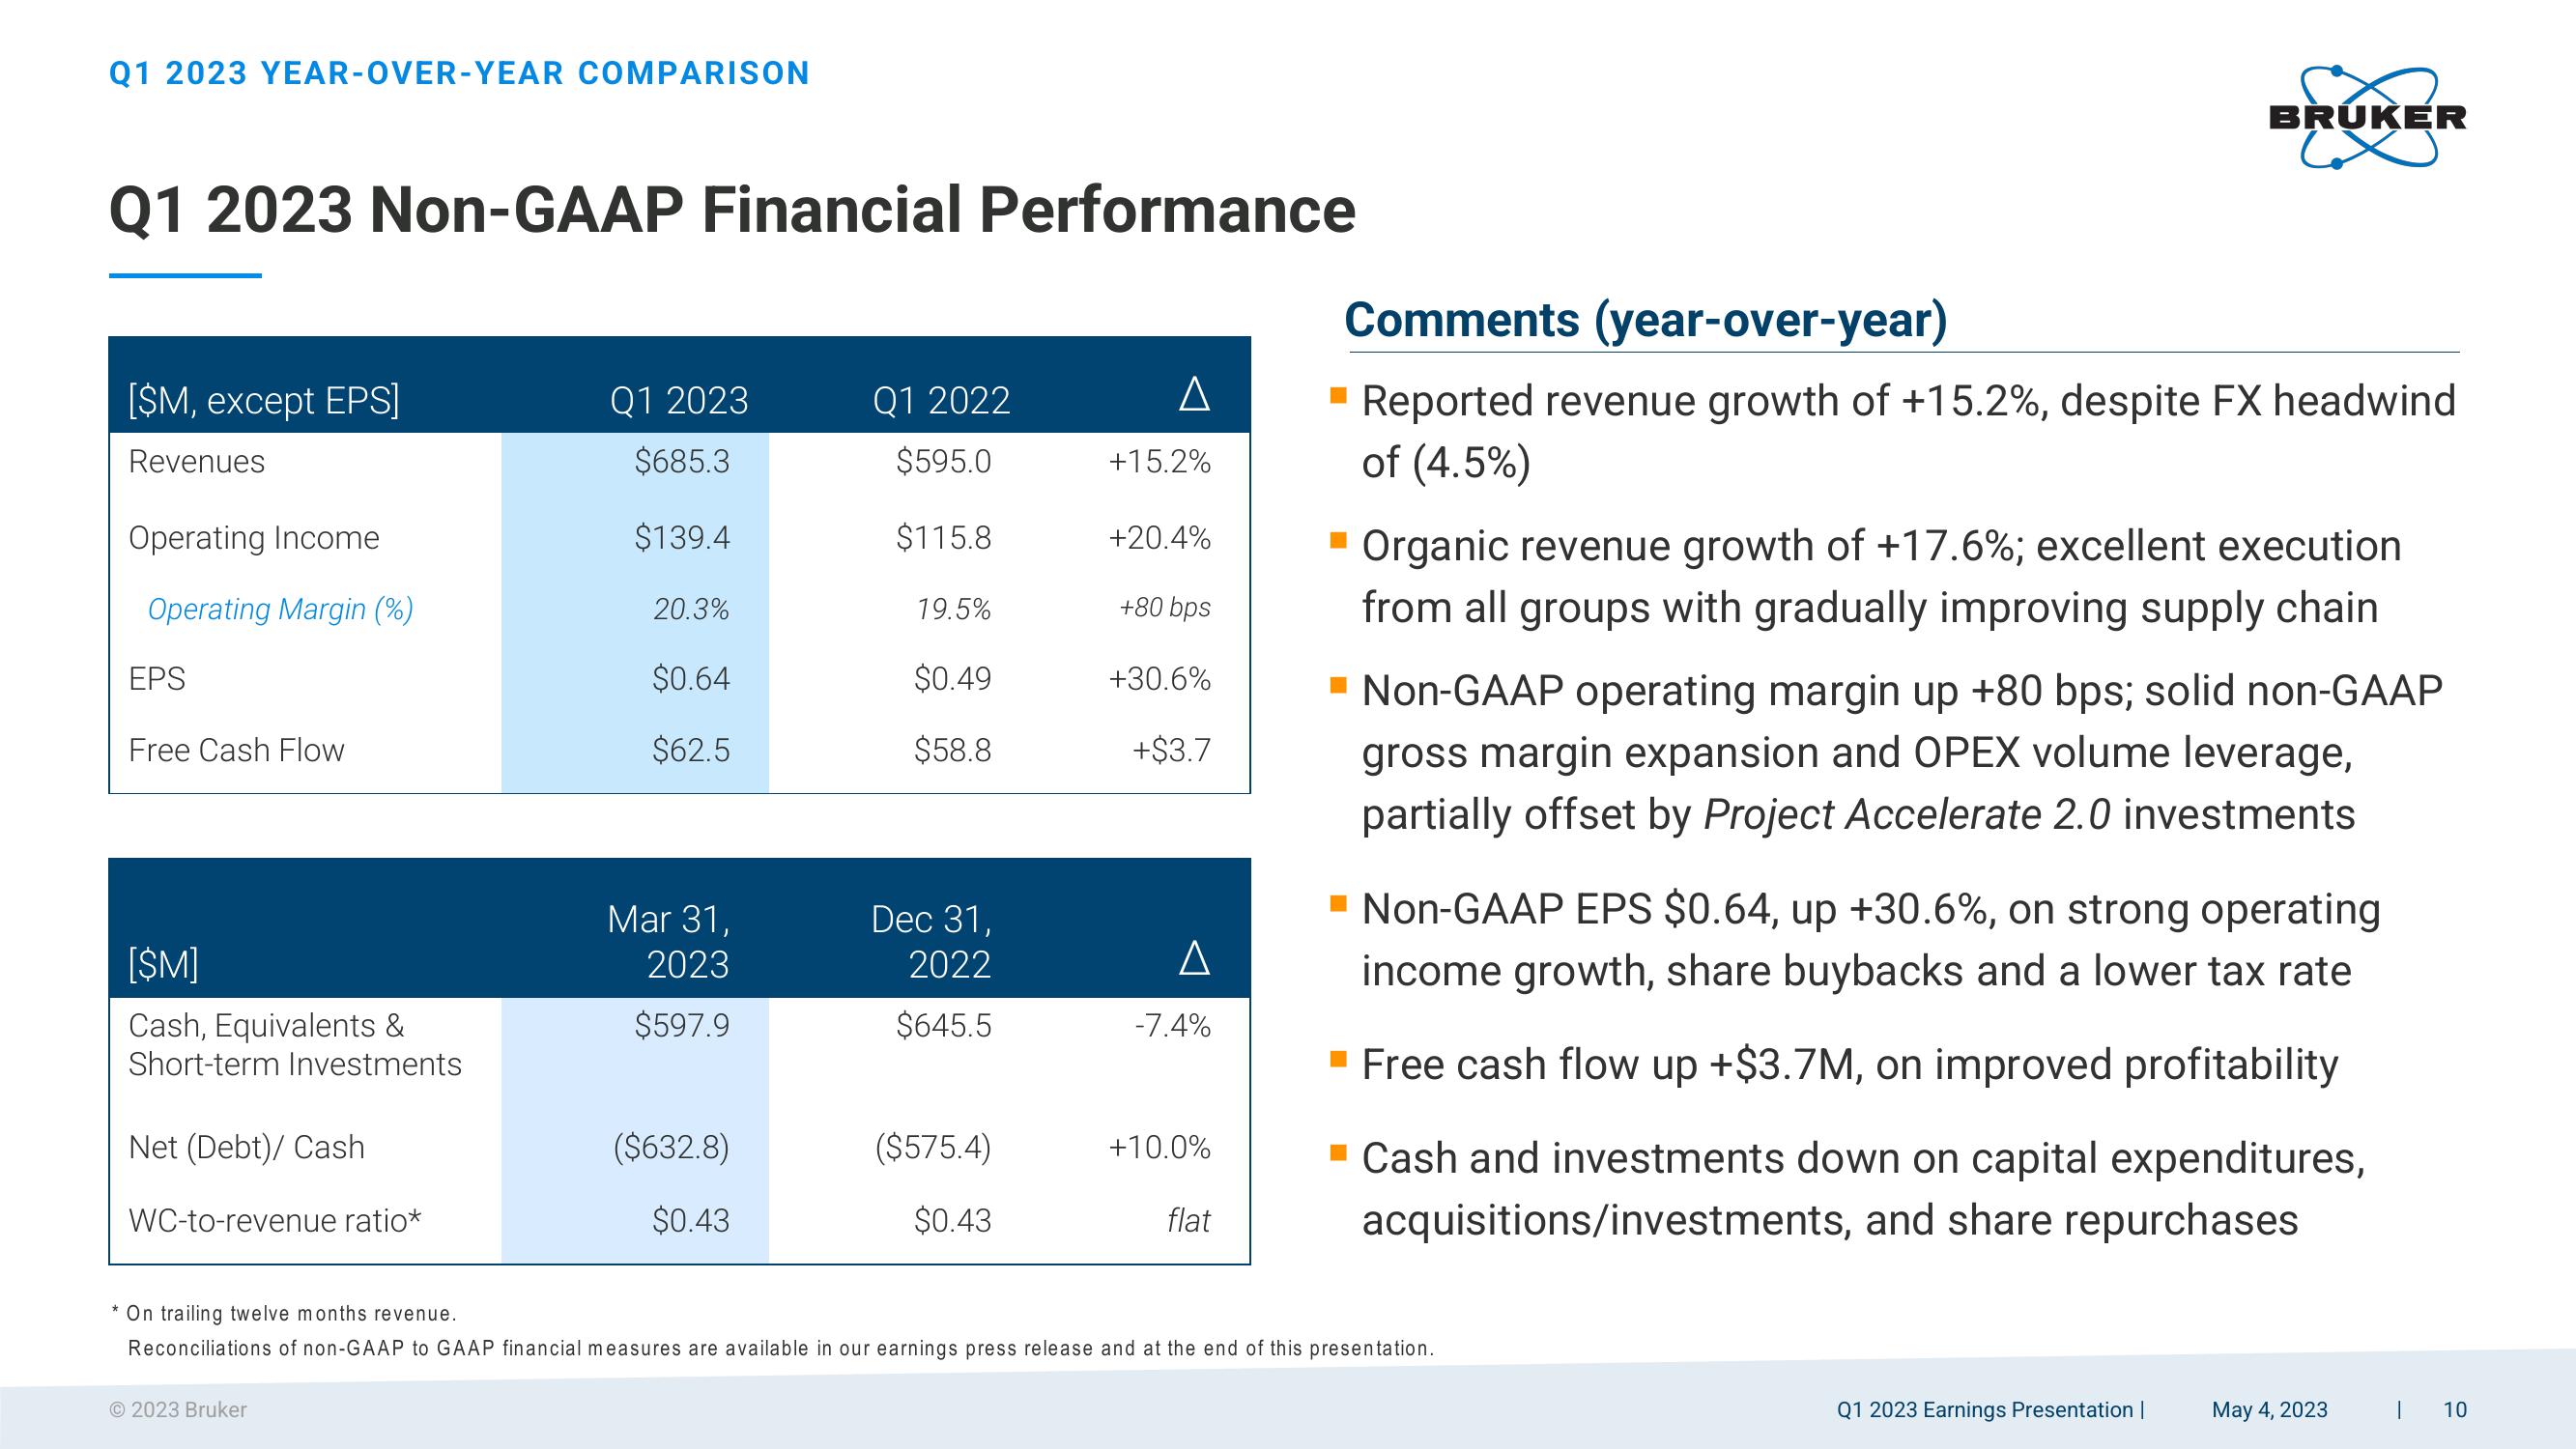
Reported revenue growth of +15.2%, despite FX headwind
of (4.5%)
BRUKER
▪ Organic revenue growth of +17.6%; excellent execution
from all groups with gradually improving supply chain
Non-GAAP operating margin up +80 bps; solid non-GAAP
gross margin expansion and OPEX volume leverage,
partially offset by Project Accelerate 2.0 investments
▪ Non-GAAP EPS $0.64, up +30.6%, on strong operating
income growth, share buybacks and a lower tax rate
*On trailing twelve months revenue.
Reconciliations of non-GAAP to GAAP financial measures are available in our earnings press release and at the end of this presentation.
■ Free cash flow up +$3.7M, on improved profitability
▪ Cash and investments down on capital expenditures,
acquisitions/investments, and share repurchases
Q1 2023 Earnings Presentation |
May 4, 2023
I
10View entire presentation