Cyxtera SPAC Presentation Deck
Expansion Potential
in Key Markets
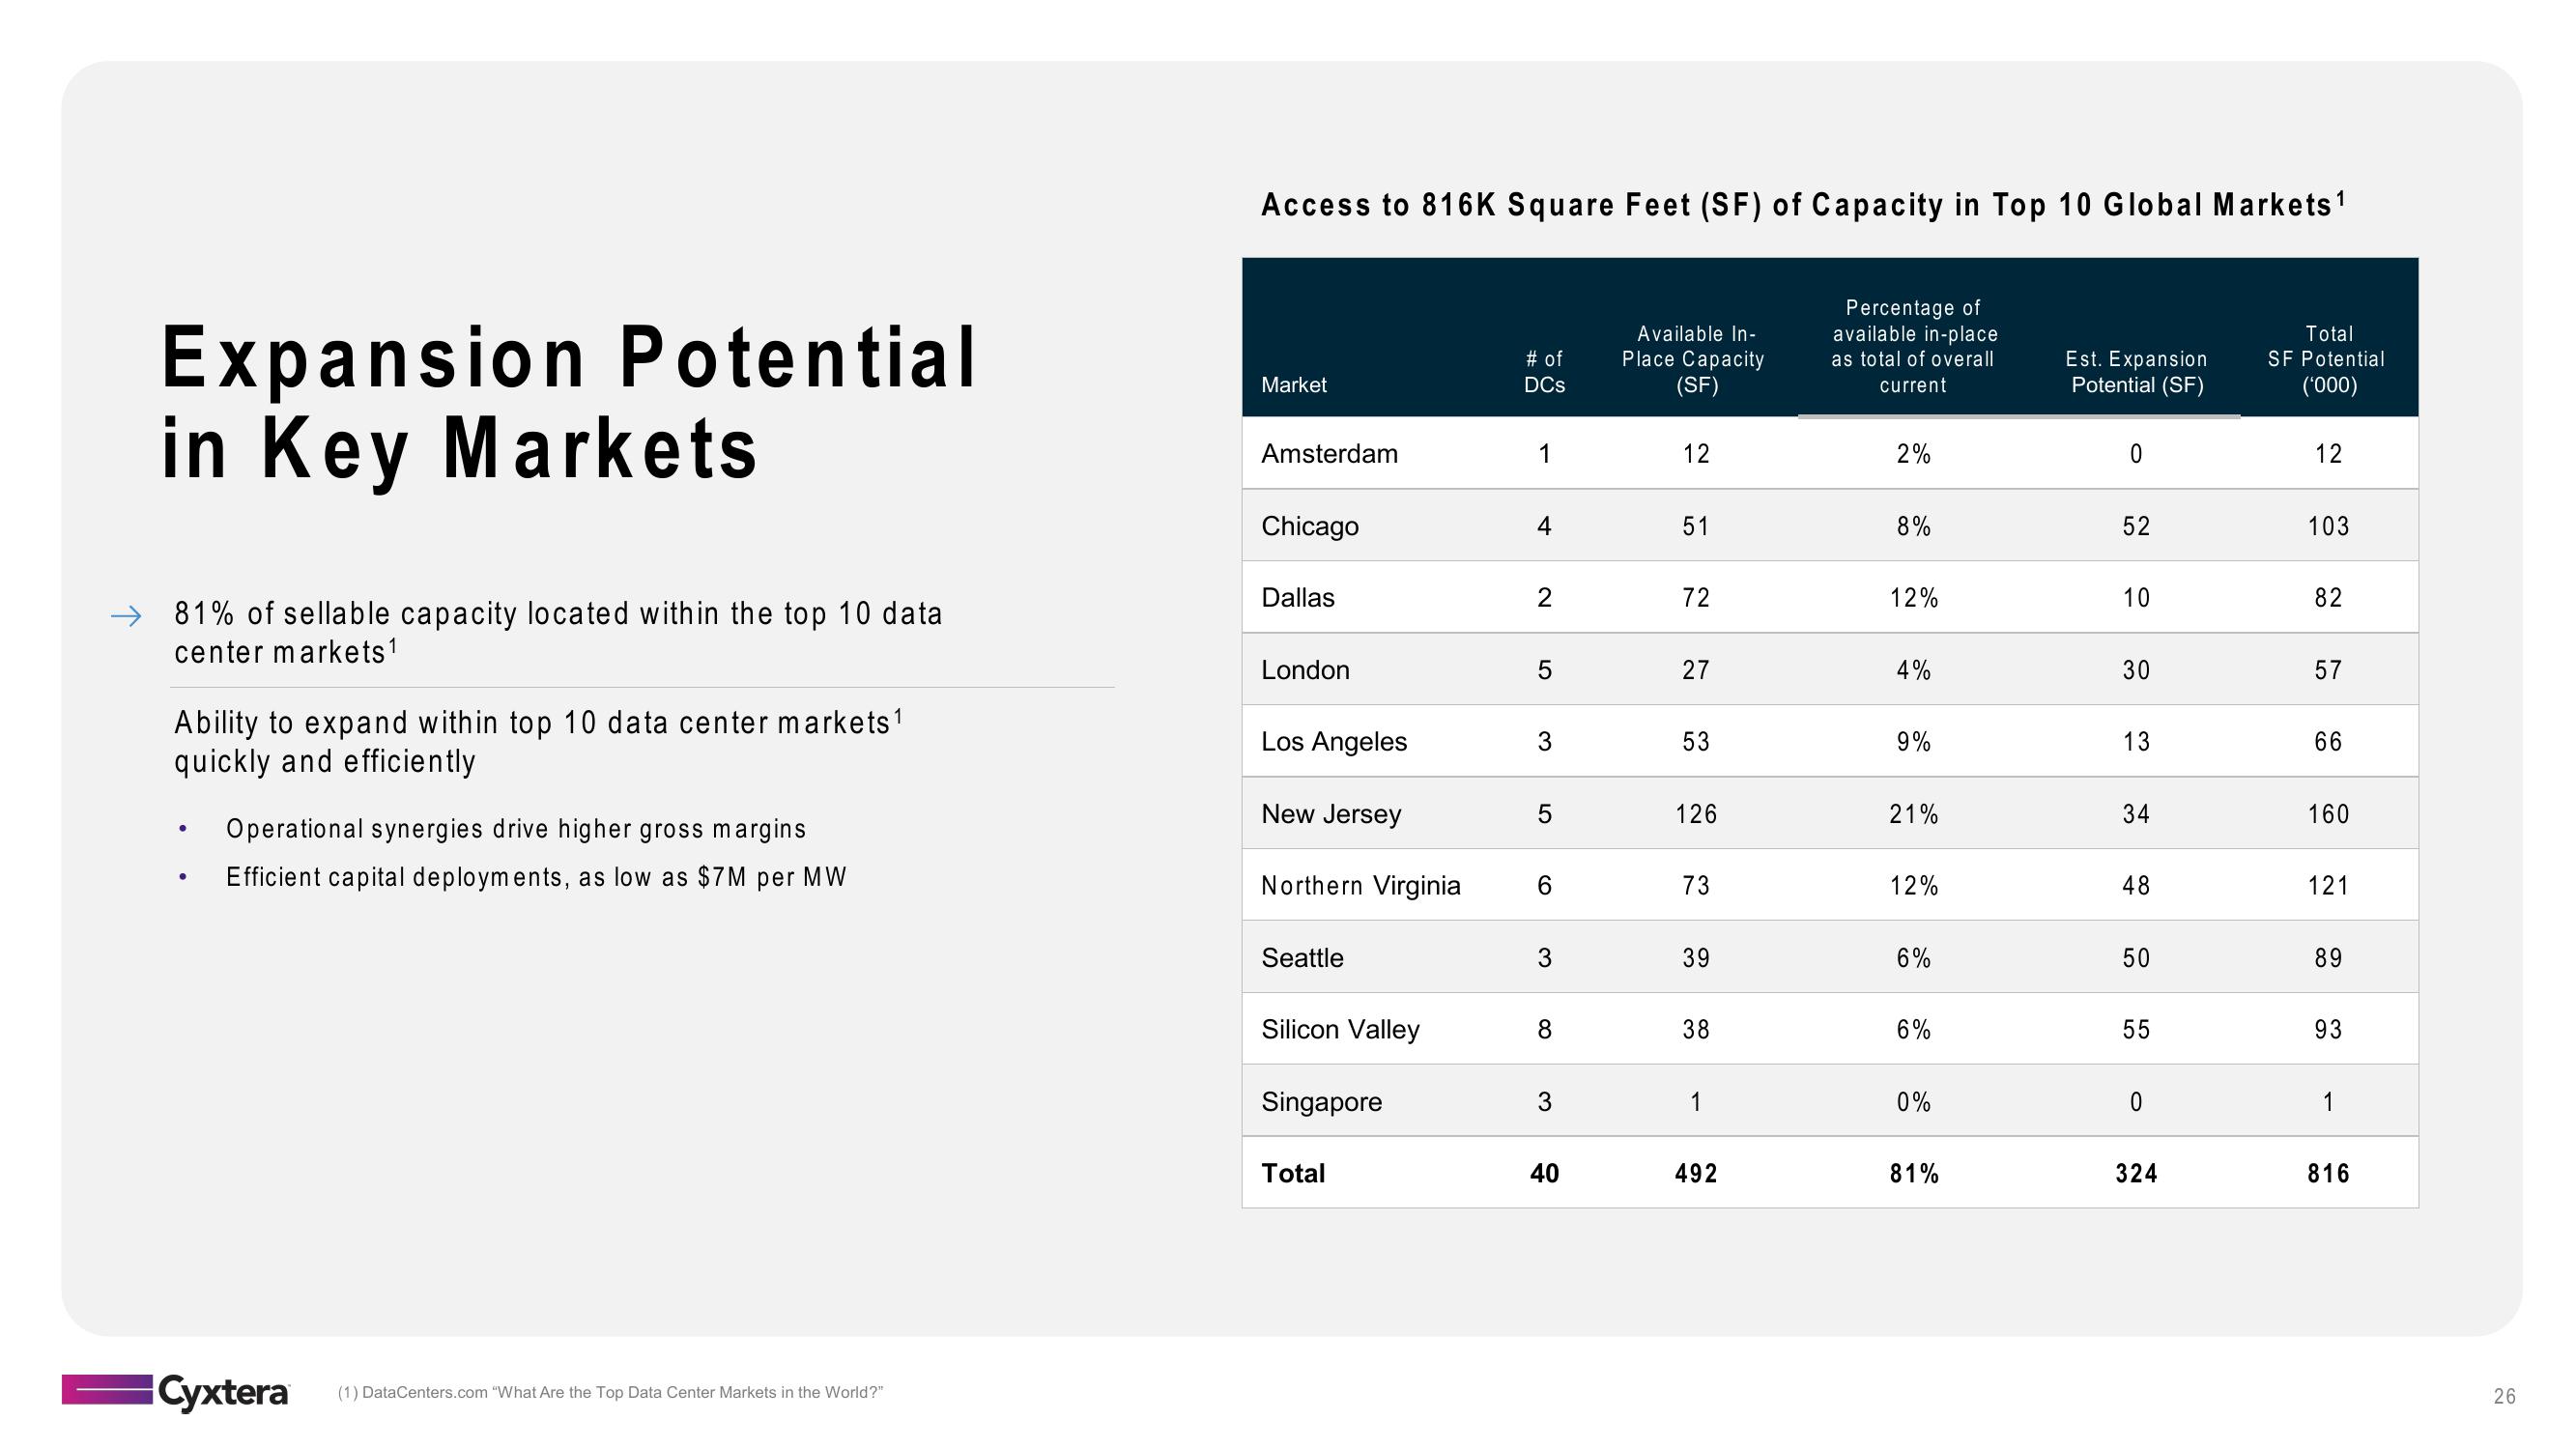
→ 81% of sellable capacity located within the top 10 data
center markets ¹
Ability to expand within top 10 data center markets ¹
quickly and efficiently
●
●
Operational synergies drive higher gross margins
Efficient capital deployments, as low as $7M per MW
Cyxtera
(1) DataCenters.com "What Are the Top Data Center Markets in the World?"
Access to 816K Square Feet (SF) of Capacity in Top 10 Global Markets ¹
Market
Amsterdam
Chicago
Dallas
London
Los Angeles
New Jersey
Northern Virginia
Seattle
Silicon Valley
Singapore
Total
# of
DCs
1
4
2
5
3
5
6
3
8
3
40
Available In-
Place Capacity
(SF)
12
51
72
27
53
126
73
39
38
1
492
Percentage of
available in-place
as total of overall
current
2%
8%
12%
4%
9%
21%
12%
6%
6%
0%
81%
Est. Expansion
Potential (SF)
0
52
10
30
13
34
48
50
55
0
324
Total
SF Potential
('000)
12
103
82
57
66
160
121
89
93
1
816
26View entire presentation