Azerion Results Presentation Deck
Financial performance
Platform leveraging integrations delivering resilient growth
Operational performance
18
16
14
12
10
86
8
6
4
2
0
ml
Q2 '22 Q3 '22 Q4 '22 Q1 '23
Q1 '22
73
Q1 '22
azerion
Financial performance
2
89
Q1 '23
4
All figures in EURm unless otherwise indicated
Avg. Gross Revenue
per Million processed
Ad Requests from
advertising auction
platform (€)
Net Revenue
Adjusted EBITDA
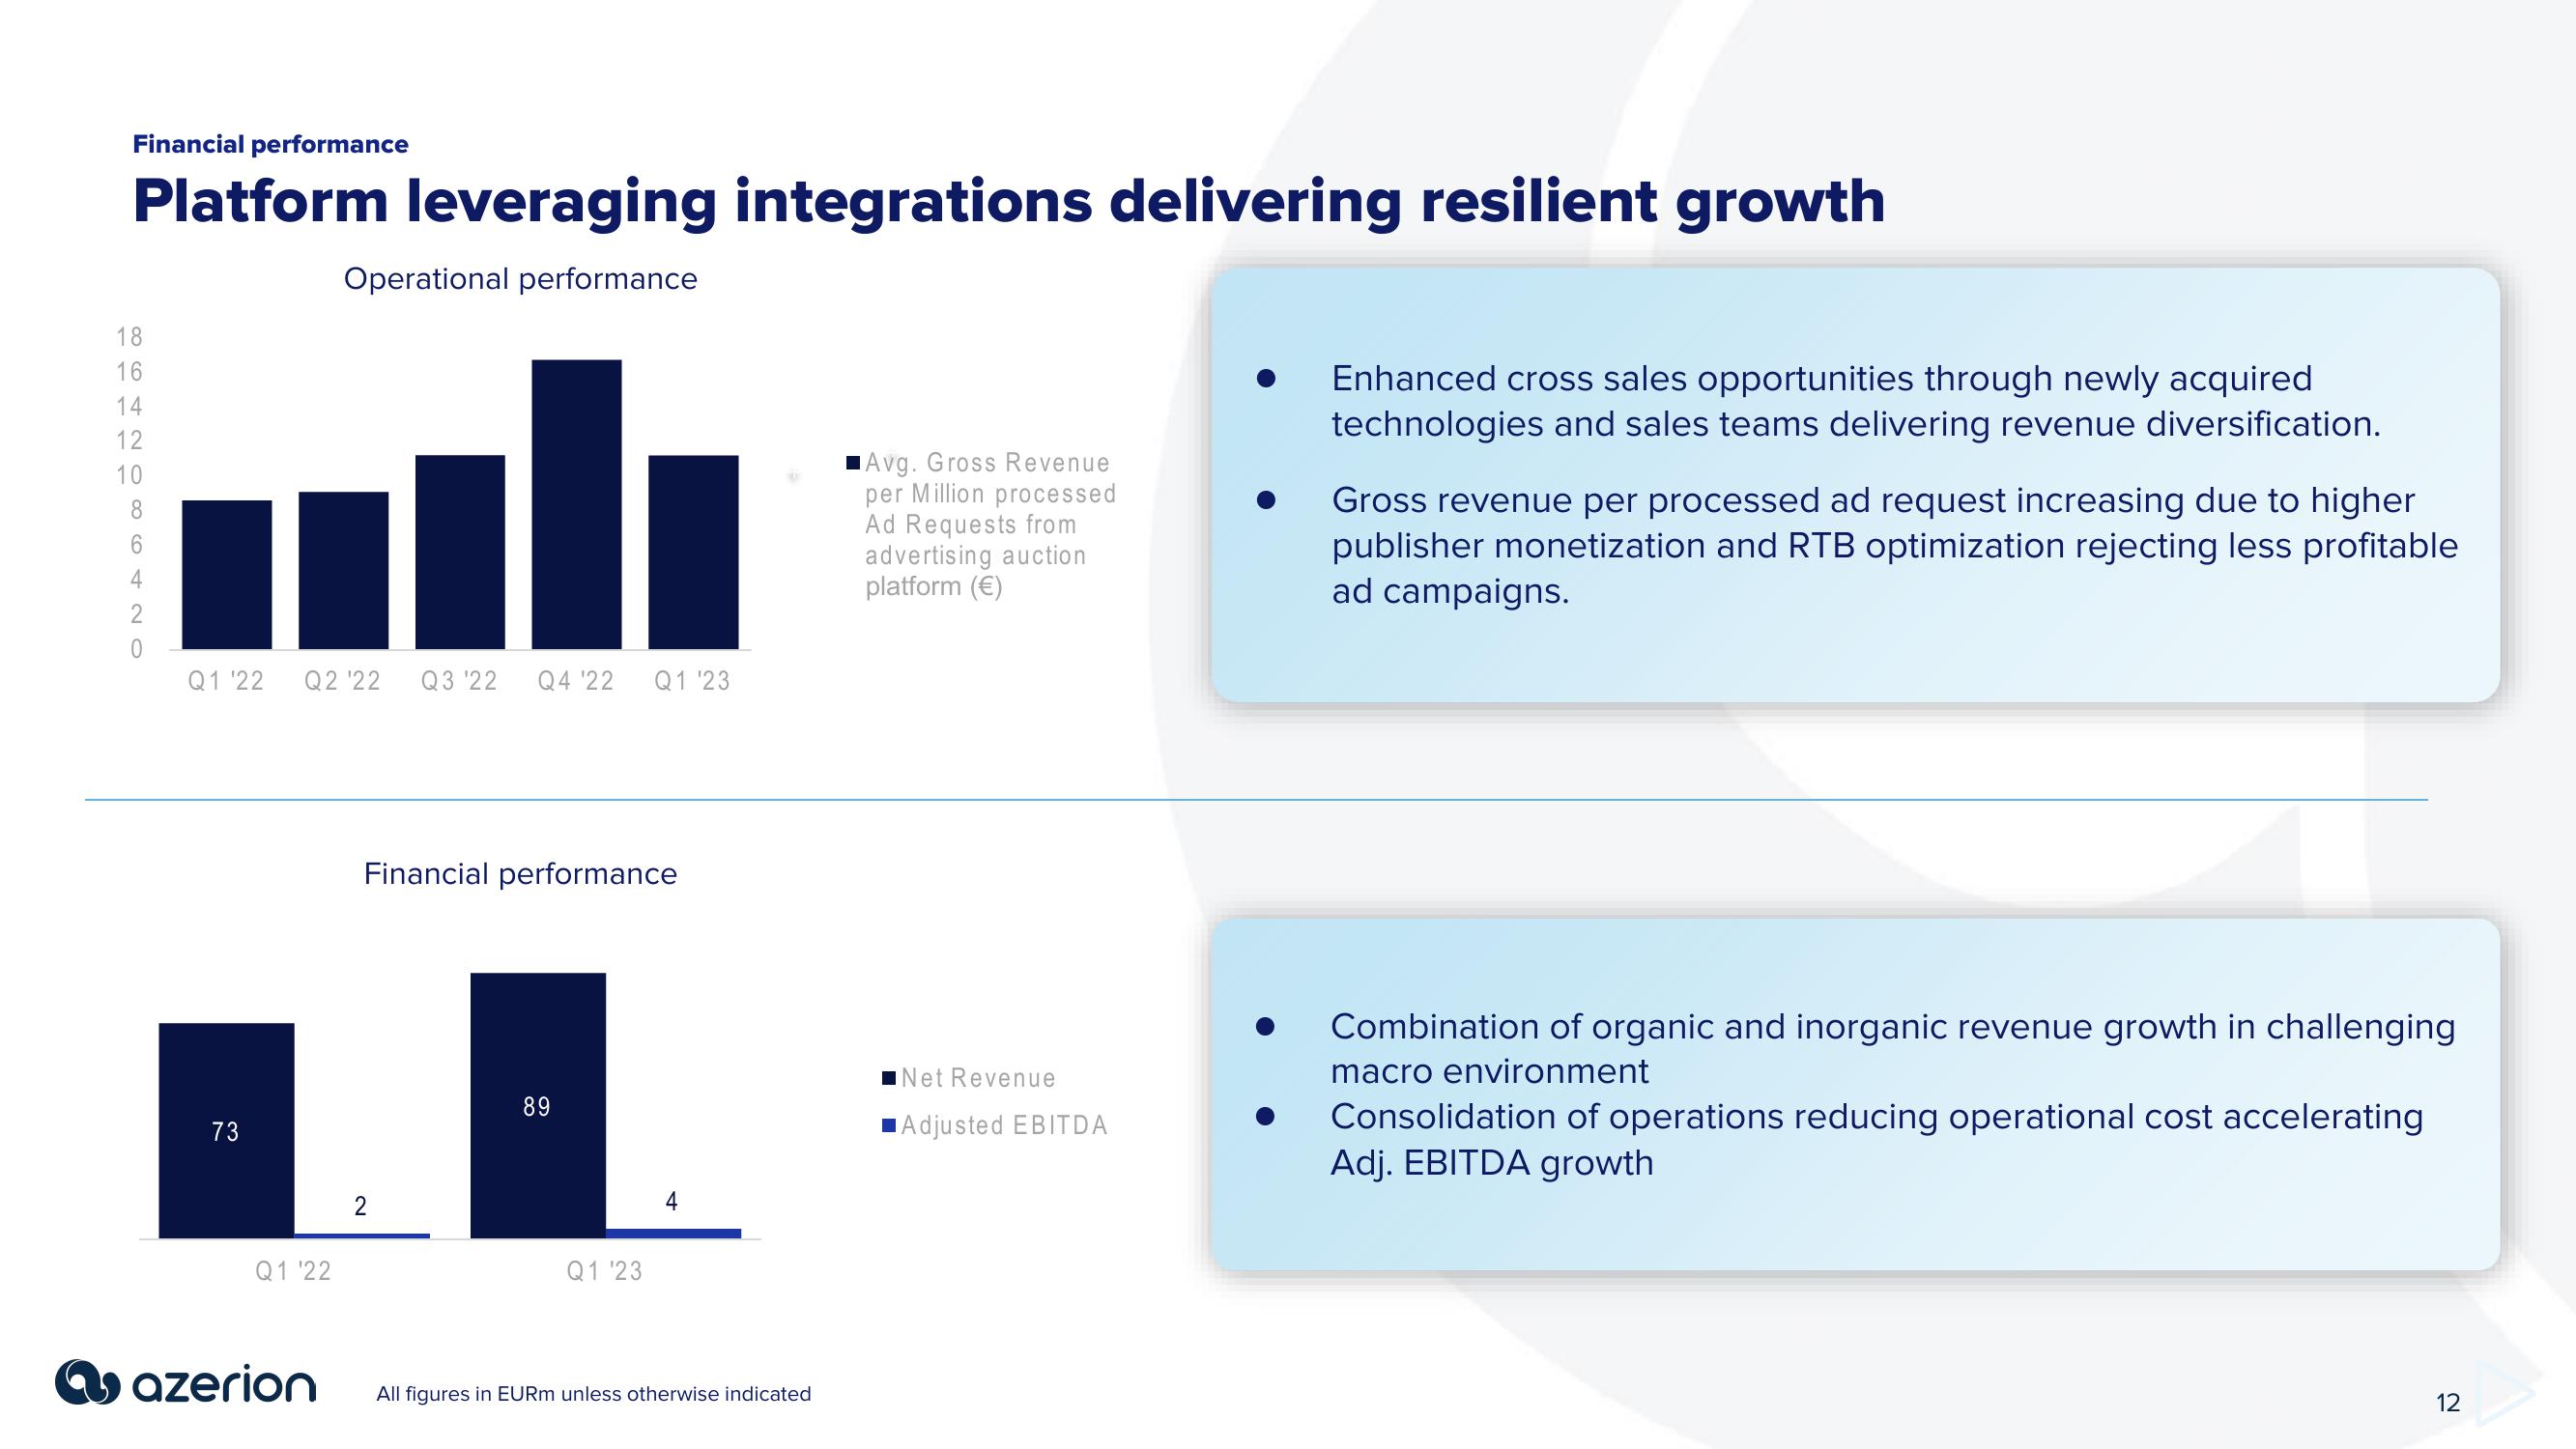
Enhanced cross sales opportunities through newly acquired
technologies and sales teams delivering revenue diversification.
Gross revenue per processed ad request increasing due to higher
publisher monetization and RTB optimization rejecting less profitable
ad campaigns.
Combination of organic and inorganic revenue growth in challenging
macro environment
Consolidation of operations reducing operational cost accelerating
Adj. EBITDA growth
12View entire presentation