Telia Company Results Presentation Deck
EBITDA
14
7.3
Q1 20
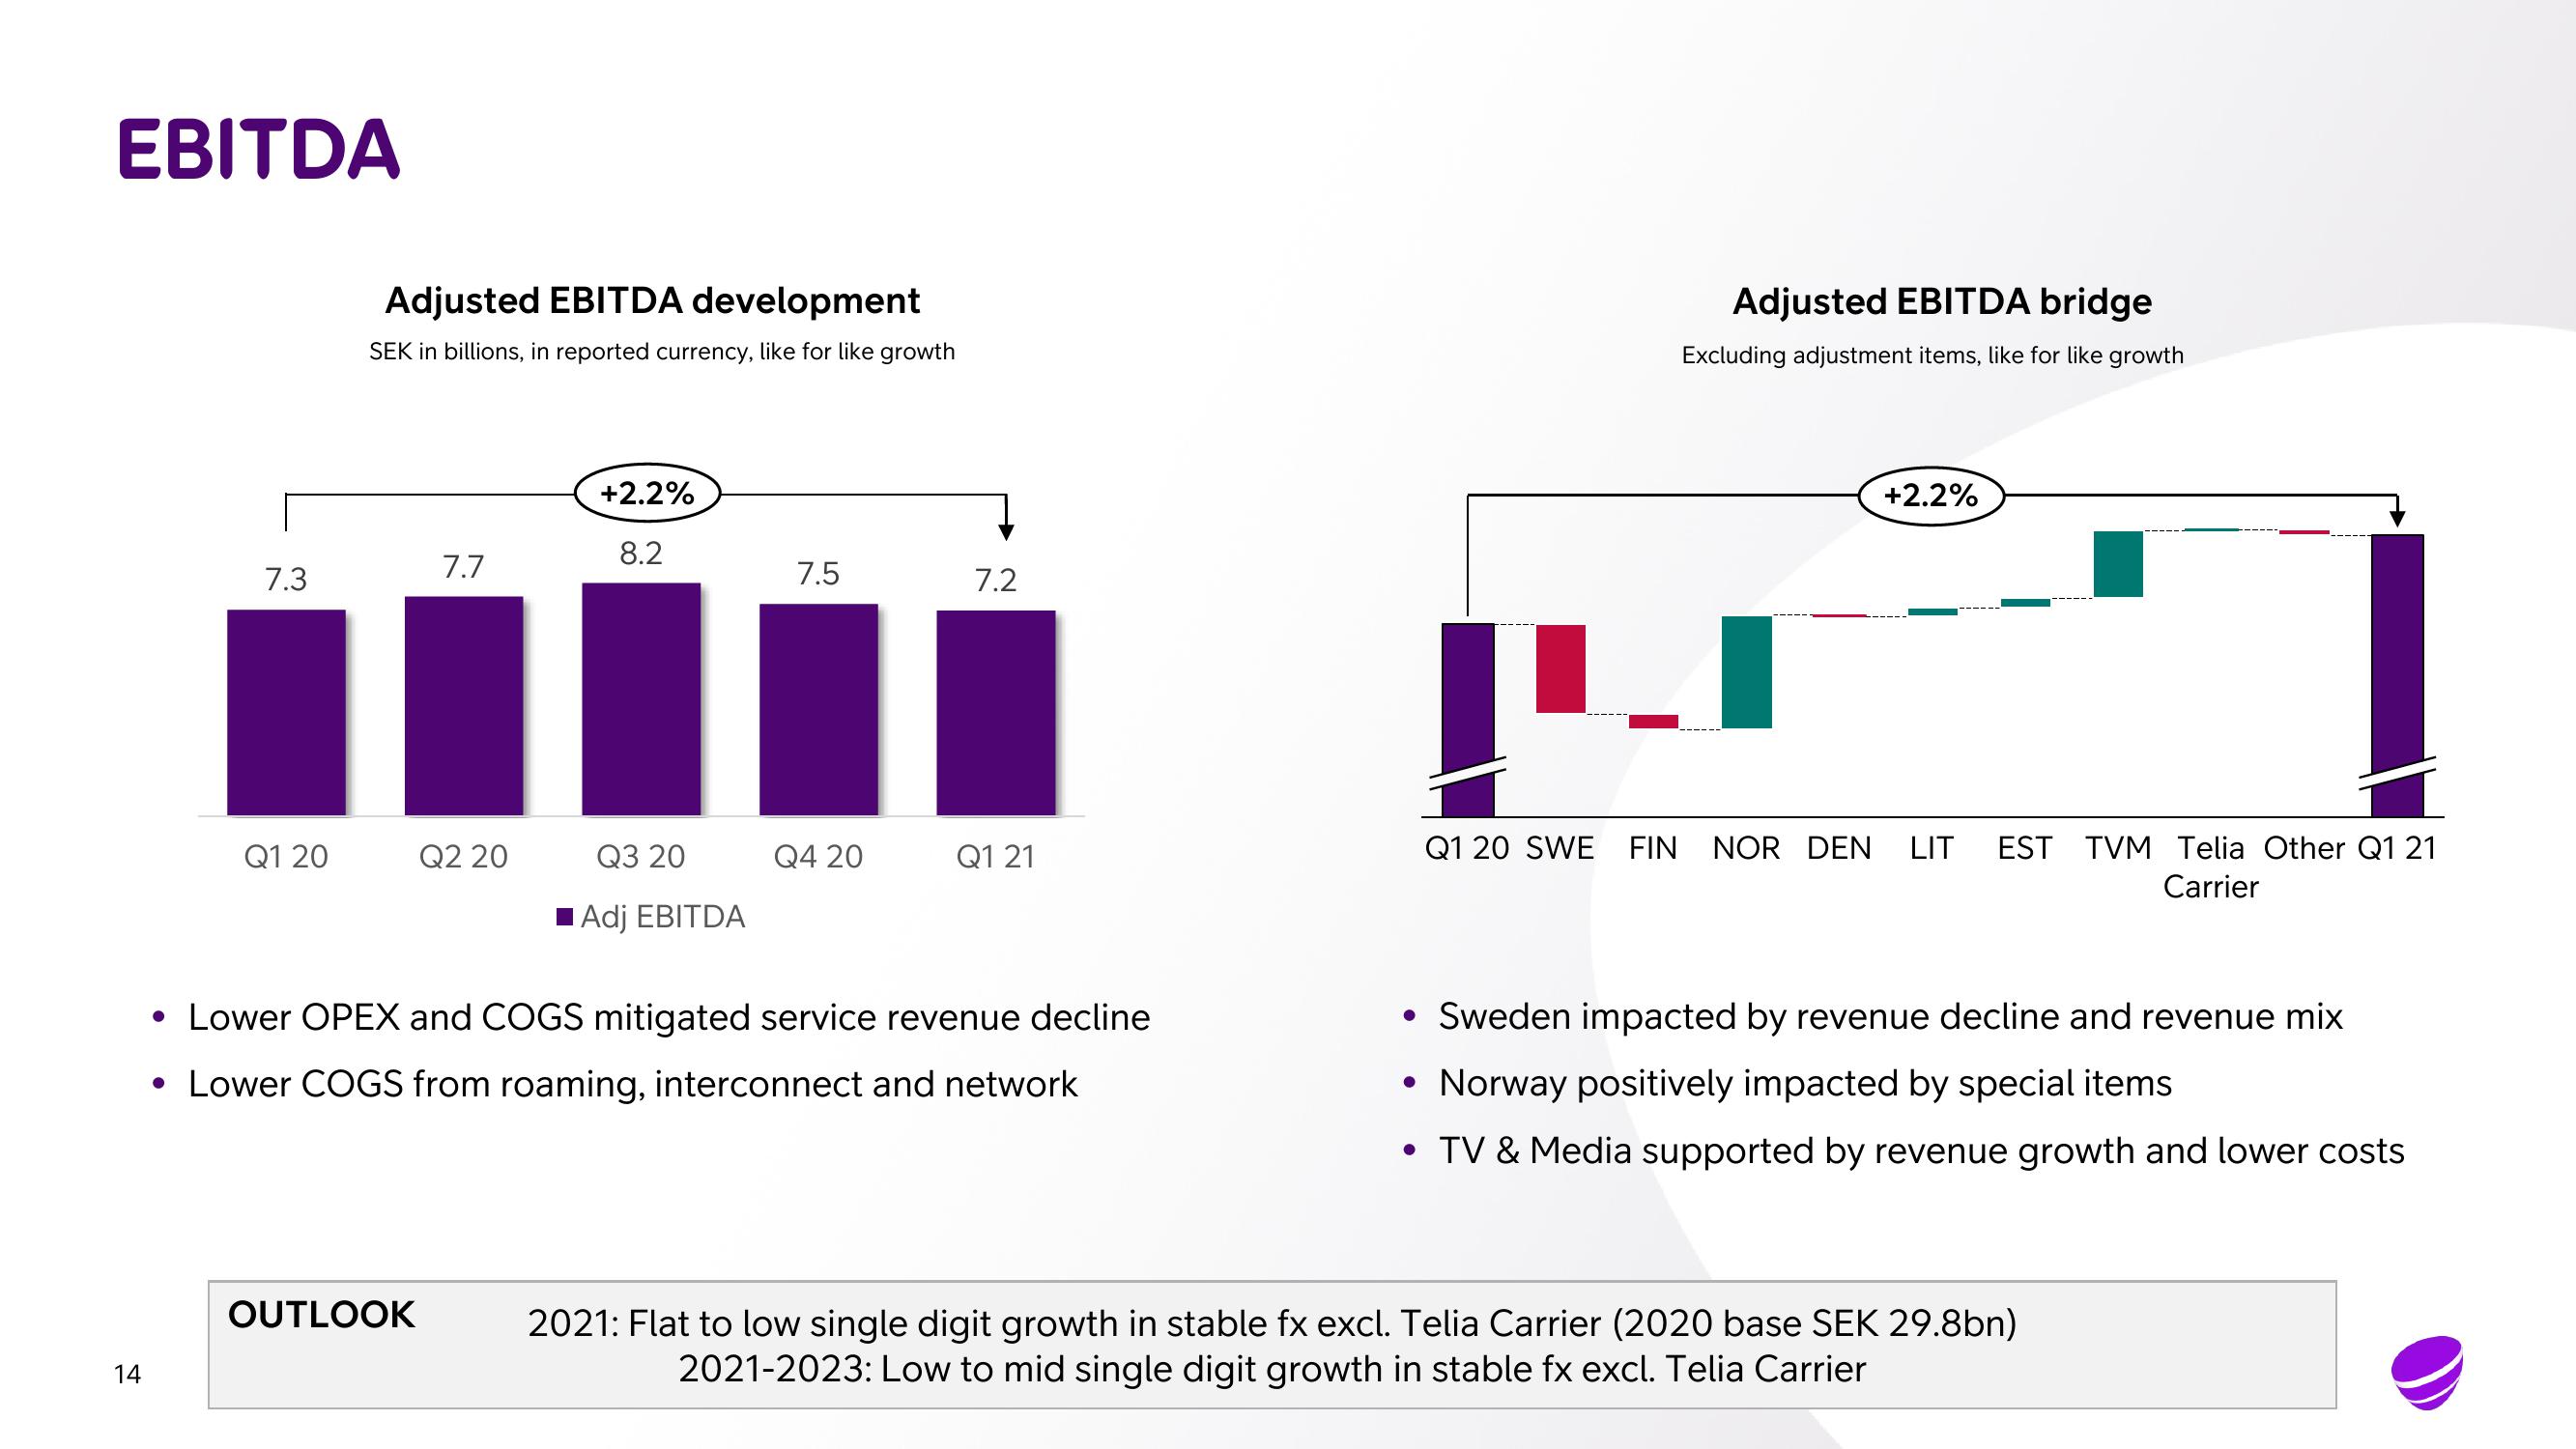
Adjusted EBITDA development
SEK in billions, in reported currency, like for like growth
7.7
OUTLOOK
Q2 20
+2.2%
8.2
Q3 20
■Adj EBITDA
7.5
Q4 20
7.2
Q1 21
• Lower OPEX and COGS mitigated service revenue decline
• Lower COGS from roaming, interconnect and network
Adjusted EBITDA bridge
Excluding adjustment items, like for like growth
●
+2.2%
Q1 20 SWE FIN NOR DEN LIT EST TVM Telia Other Q1 21
Carrier
• Sweden impacted by revenue decline and revenue mix
Norway positively impacted by special items
• TV & Media supported by revenue growth and lower costs
2021: Flat to low single digit growth in stable fx excl. Telia Carrier (2020 base SEK 29.8bn)
2021-2023: Low to mid single digit growth in stable fx excl. Telia CarrierView entire presentation