First Quarter 2017 Financial Review
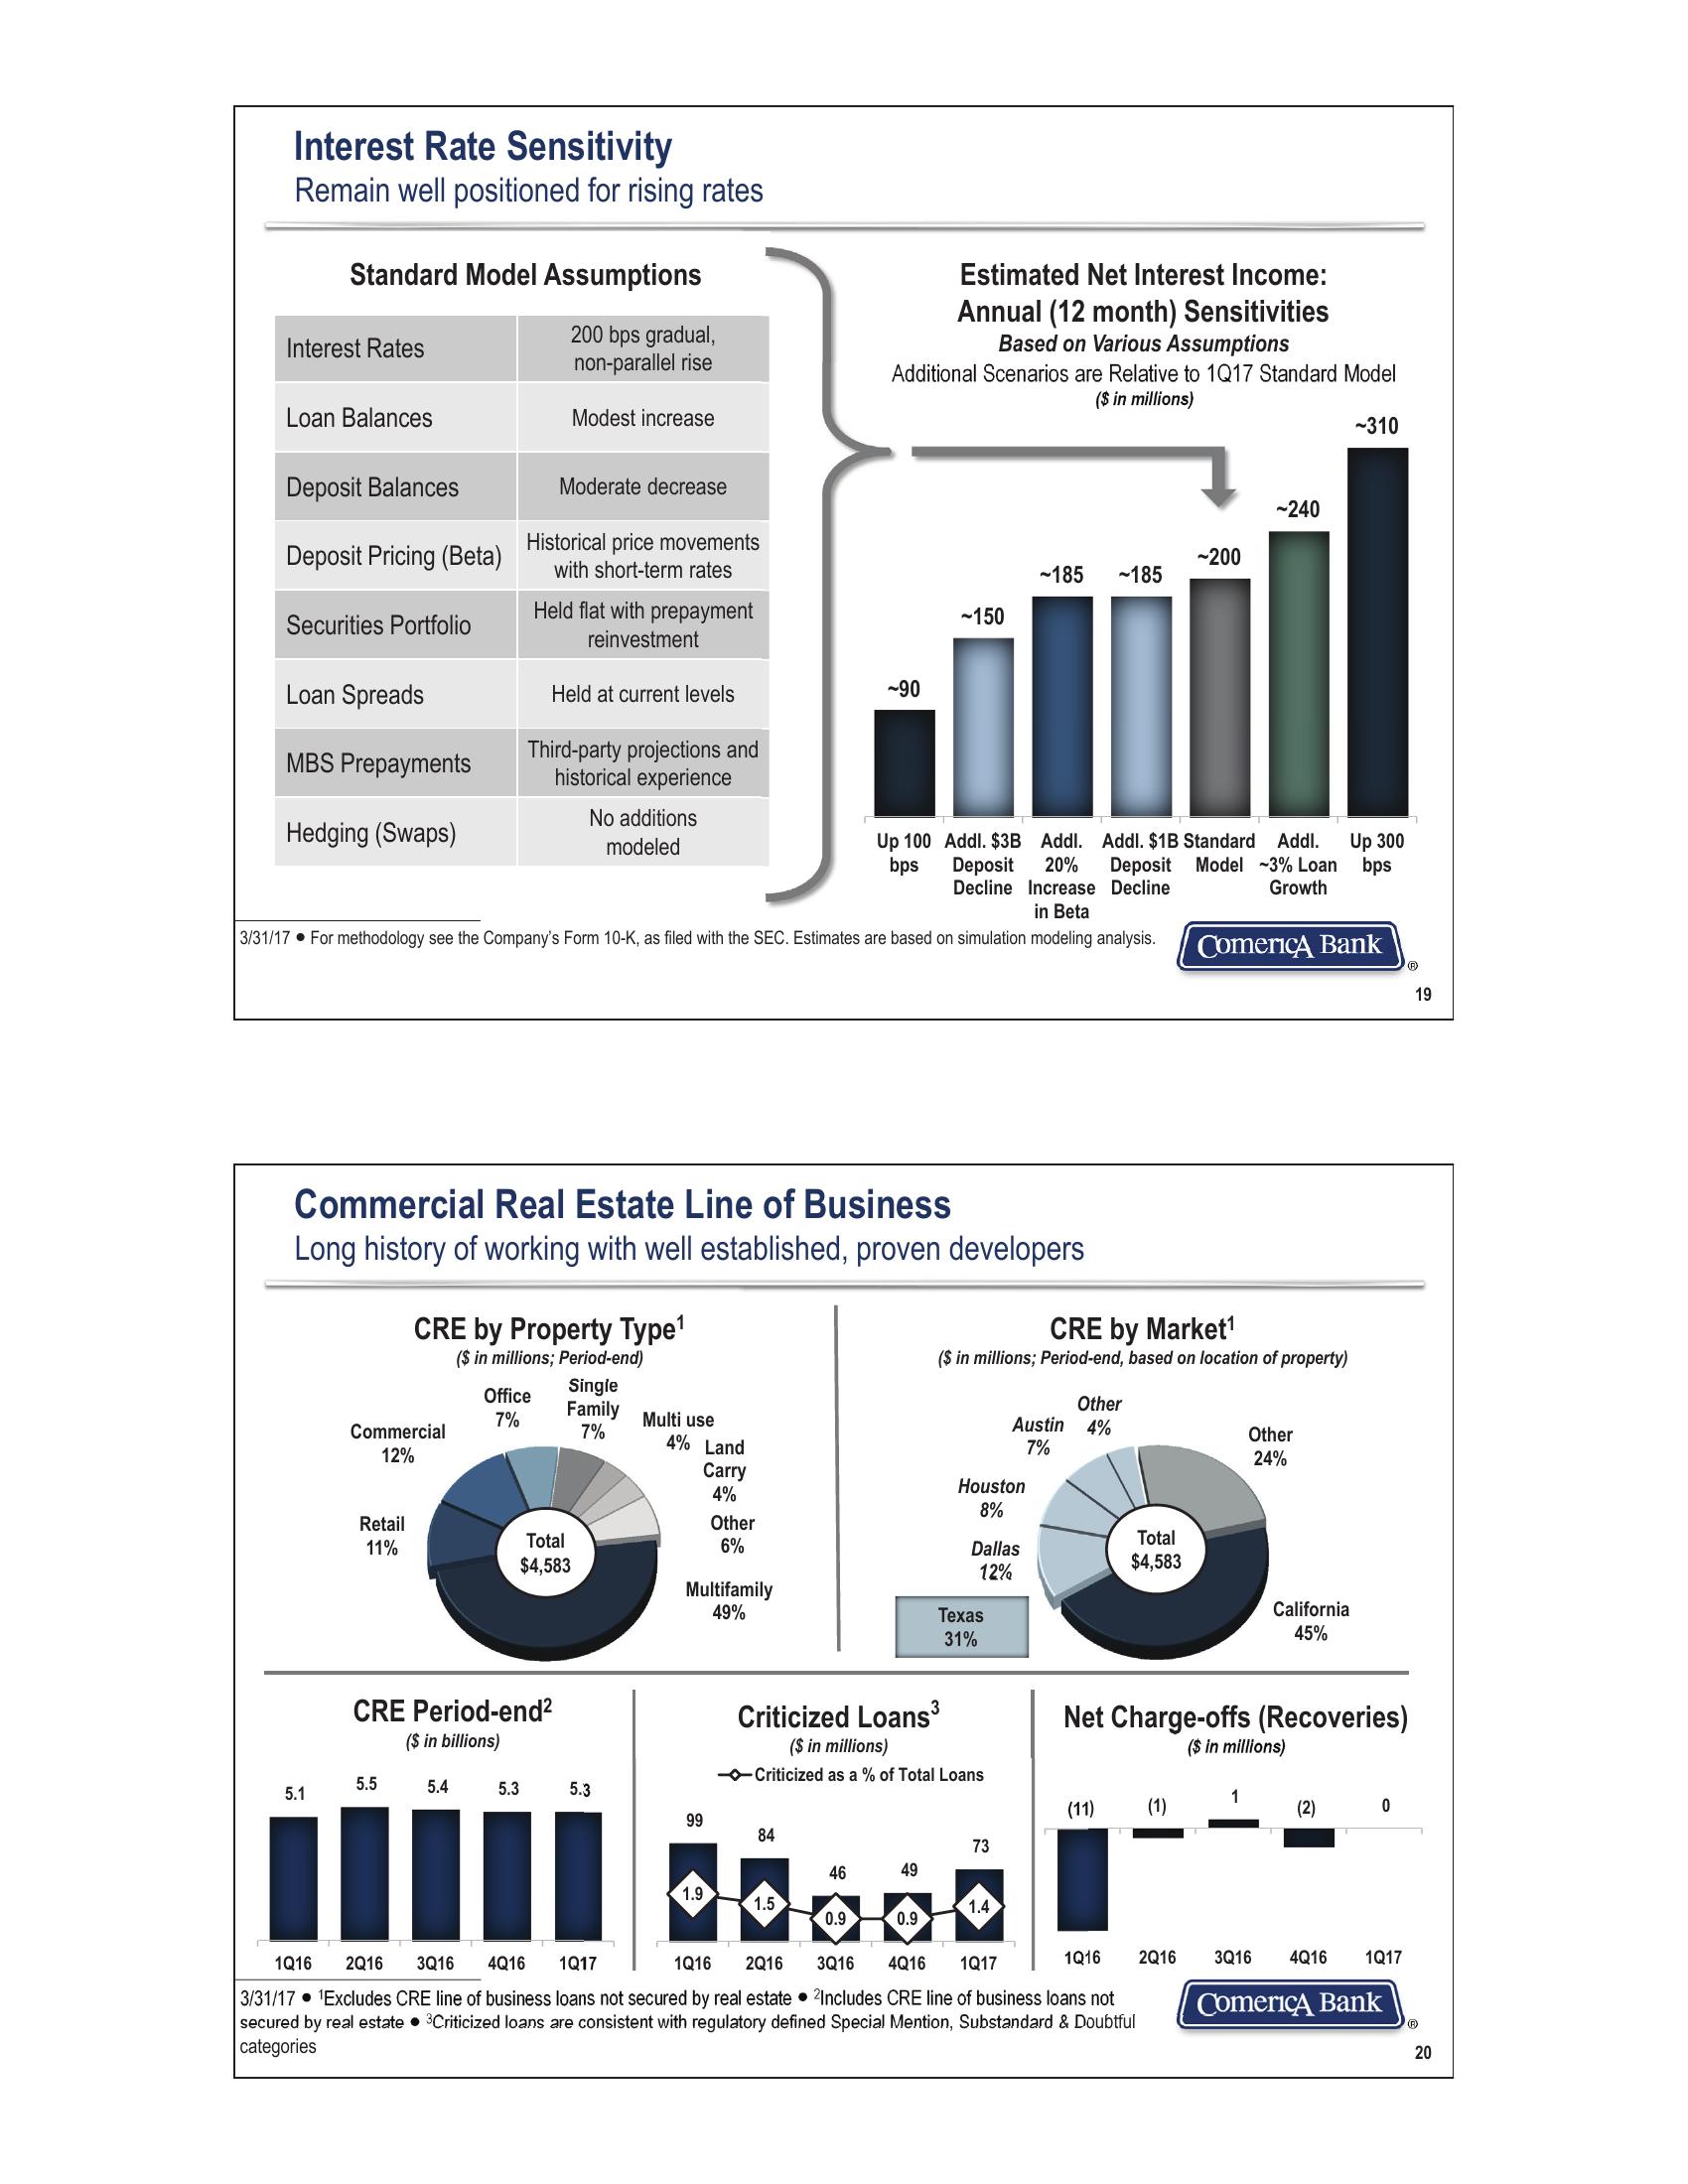
Interest Rate Sensitivity
Remain well positioned for rising rates
Standard Model Assumptions
Interest Rates
200 bps gradual,
non-parallel rise
Modest increase
Loan Balances
Deposit Balances
Deposit Pricing (Beta)
Securities Portfolio
Loan Spreads
MBS Prepayments
Hedging (Swaps)
Moderate decrease
Historical price movements
with short-term rates
Held flat with prepayment
reinvestment
Held at current levels
Third-party projections and
historical experience
No additions
modeled
Estimated Net Interest Income:
Annual (12 month) Sensitivities
Based on Various Assumptions
Additional Scenarios are Relative to 1Q17 Standard Model
($ in millions)
-90
~240
-200
~185
-185
150
-310
Up 100 Addl. $3B Addl. Addl. $1B Standard Addl.
bps
Deposit 20% Deposit Model -3% Loan
Decline Increase Decline
in Beta
Up 300
bps
Growth
3/31/17 For methodology see the Company's Form 10-K, as filed with the SEC. Estimates are based on simulation modeling analysis.
Comerica Bank
Ⓡ
19
Commercial Real Estate Line of Business
Long history of working with well established, proven developers
CRE by Property Type¹
($ in millions; Period-end)
CRE by Market¹
($ in millions; Period-end, based on location of property)
Office
7%
Single
Family Multi use
Commercial
12%
7%
4% Land
Carry
4%
Other
Austin 4%
7%
Other
24%
Houston
8%
Retail
11%
Other
Total
$4,583
6%
Dallas
12%
Total
$4,583
Multifamily
49%
Texas
31%
California
45%
CRE Period-end²
($ in billions)
Criticized Loans³
($ in millions)
Criticized as a % of Total Loans
Net Charge-offs (Recoveries)
($ in millions)
5.5
5.1
5.4
5.3
5.3
(11)
(1)
(2)0
99
84
73
46
49
1.9
1.5
1.4
0.9
0.9
1Q16
2Q16 3Q16 4Q16
1Q17
1Q16
2Q16
3Q16
4Q16
1Q17
1Q16
2Q16
3Q16
4Q16
1Q17
3/31/17 Excludes CRE line of business loans not secured by real estate ⚫2Includes CRE line of business loans not
secured by real estate ⚫3Criticized loans are consistent with regulatory defined Special Mention, Substandard & Doubtful
categories
Comerica Bank
20View entire presentation