Main Street Capital Investor Day Presentation Deck
BDCs
Dividend
Public for > 2 Years (3)
Main Street Capital Corporation
Monroe Capital Corporation
New Mountain Finance Corporation
Oaktree Specialty Lending Corporation
OFS Capital Corporation
Owl Rock Capital Corp
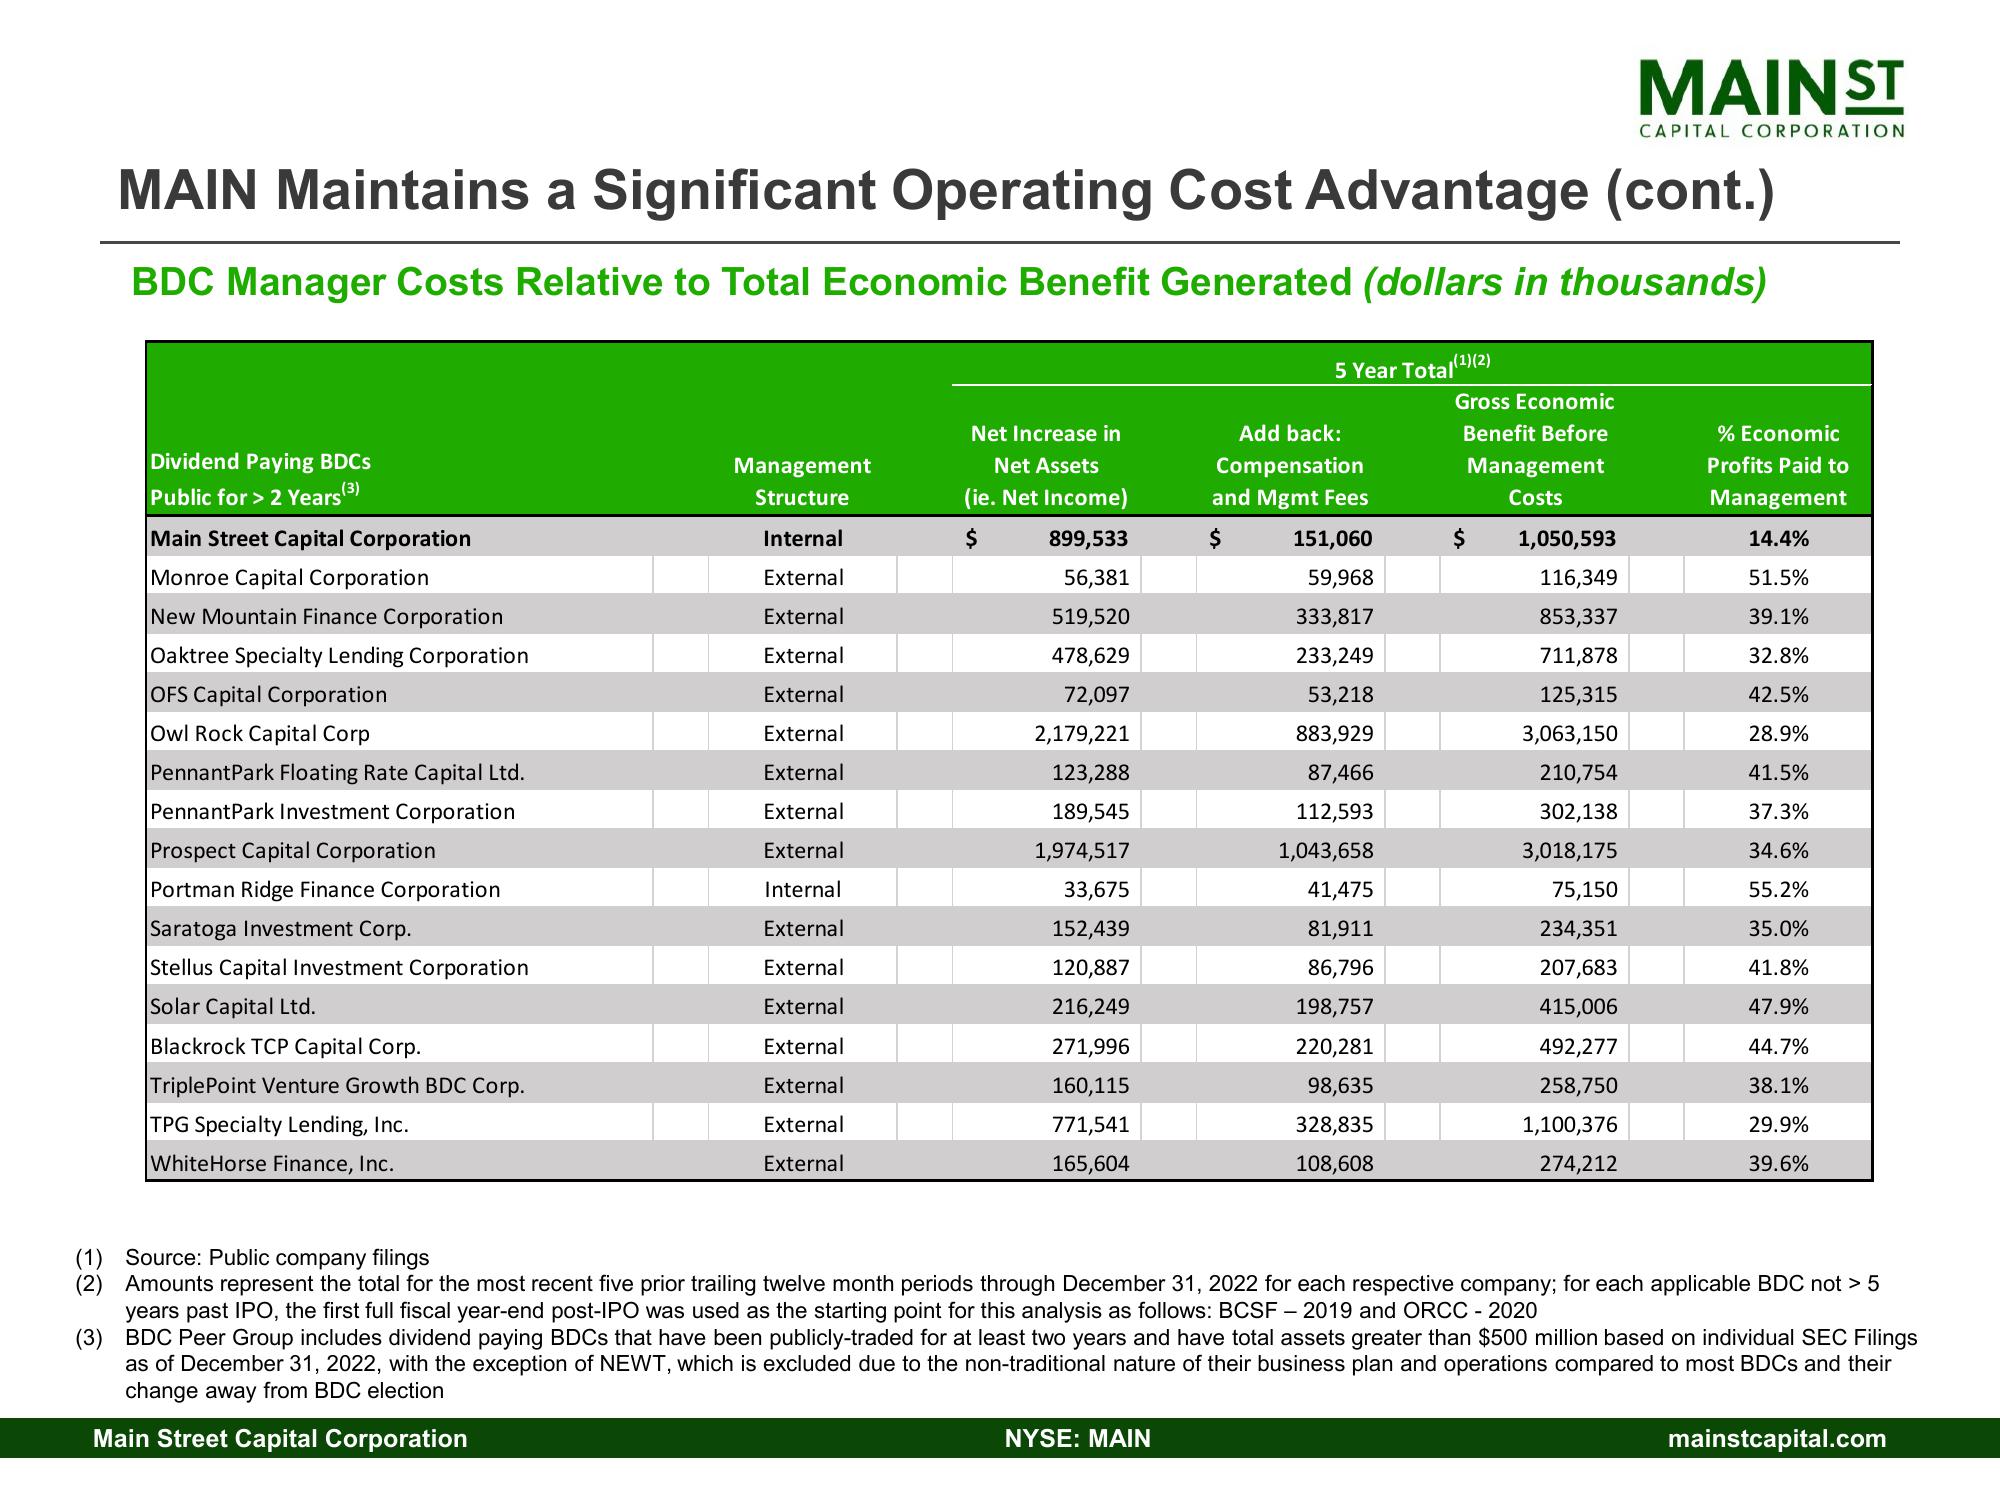
MAIN Maintains a Significant Operating Cost Advantage (cont.)
BDC Manager Costs Relative to Total Economic Benefit Generated (dollars in thousands)
Pennant Park Floating Rate Capital Ltd.
Pennant Park Investment Corporation
Prospect Capital Corporation
Portman Ridge Finance Corporation
Saratoga Investment Corp.
Stellus Capital Investment Corporation
Solar Capital Ltd.
Blackrock TCP Capital Corp.
Triple Point Venture Growth BDC Corp.
TPG Specialty Lending, Inc.
WhiteHorse Finance, Inc.
Management
Structure
Internal
External
External
External
External
External
External
External
External
Internal
External
External
External
External
External
External
External
Net Increase in
Net Assets
(ie. Net Income)
899,533
56,381
519,520
$
478,629
72,097
2,179,221
123,288
189,545
1,974,517
33,675
152,439
120,887
216,249
271,996
160,115
771,541
165,604
5 Year Total(¹)(2)
NYSE: MAIN
Add back:
Compensation
and Mgmt Fees
$ 151,060
59,968
333,817
233,249
53,218
883,929
87,466
112,593
1,043,658
41,475
81,911
86,796
198,757
220,281
98,635
328,835
108,608
Gross Economic
Benefit Before
Management
Costs
$
MAIN ST
1,050,593
116,349
853,337
711,878
125,315
3,063,150
210,754
302,138
3,018,175
75,150
234,351
207,683
415,006
492,277
258,750
1,100,376
274,212
CAPITAL CORPORATION
% Economic
Profits Paid to
Management
14.4%
51.5%
39.1%
32.8%
42.5%
28.9%
41.5%
37.3%
34.6%
55.2%
35.0%
41.8%
47.9%
44.7%
38.1%
29.9%
39.6%
(1) Source: Public company filings
(2) Amounts represent the total for the most recent five prior trailing twelve month periods through December 31, 2022 for each respective company; for each applicable BDC not > 5
years past IPO, the first full fiscal year-end post-IPO was used as the starting point for this analysis as follows: BCSF - 2019 and ORCC - 2020
(3) BDC Peer Group includes dividend paying BDCs that have been publicly-traded for at least two years and have total assets greater than $500 million based on individual SEC Filings
as of December 31, 2022, with the exception of NEWT, which is excluded due to the non-traditional nature of their business plan and operations compared to most BDCs and their
change away from BDC election
Main Street Capital Corporation
mainstcapital.comView entire presentation