Marti SPAC Presentation Deck
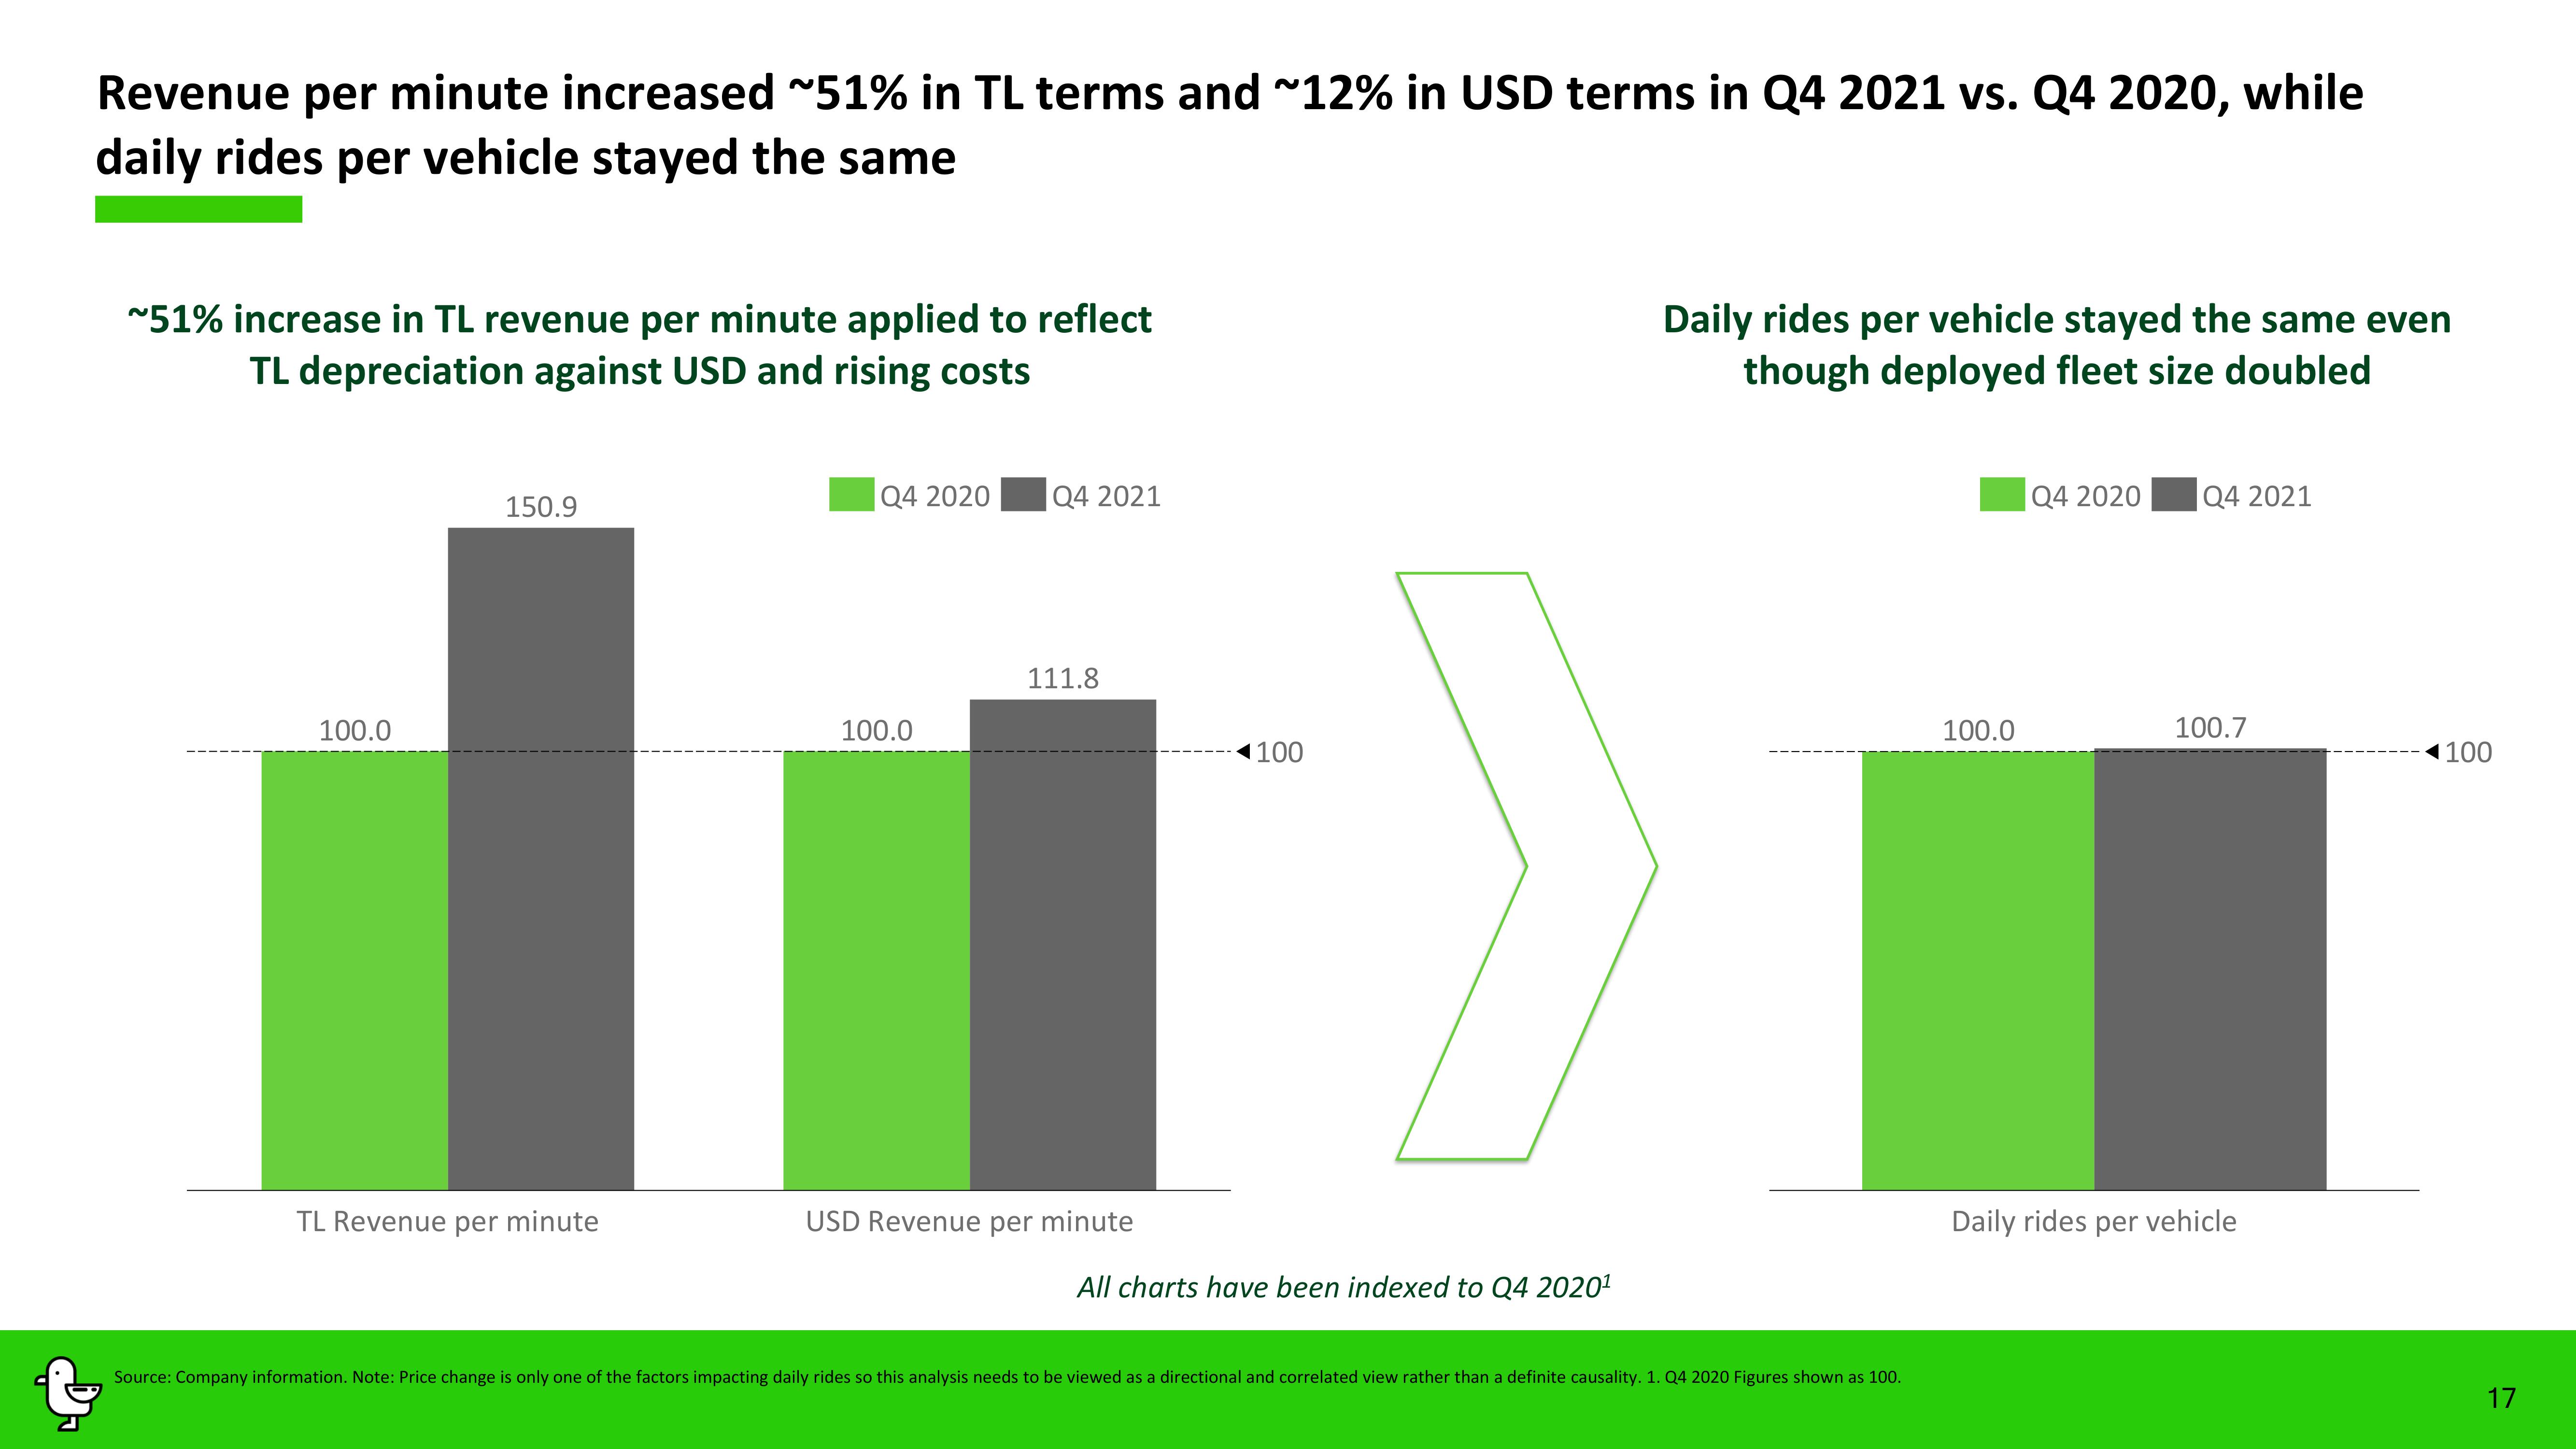
Revenue per minute increased ~51% in TL terms and ~12% in USD terms in Q4 2021 vs. Q4 2020, while
daily rides per vehicle stayed the same
~51% increase in TL revenue per minute applied to reflect
TL depreciation against USD and rising costs
100.0
150.9
TL Revenue per minute
Q4 2020
100.0
Q4 2021
111.8
USD Revenue per minute
100
All charts have been indexed to Q4 2020¹
Daily rides per vehicle stayed the same even
though deployed fleet size doubled
Source: Company information. Note: Price change is only one of the factors impacting daily rides so this analysis needs to be viewed as a directional and correlated view rather than a definite causality. 1. Q4 2020 Figures shown as 100.
100.0
Q4 2020 Q4 2021
100.7
Daily rides per vehicle
100
17View entire presentation