Azek Investor Presentation Deck
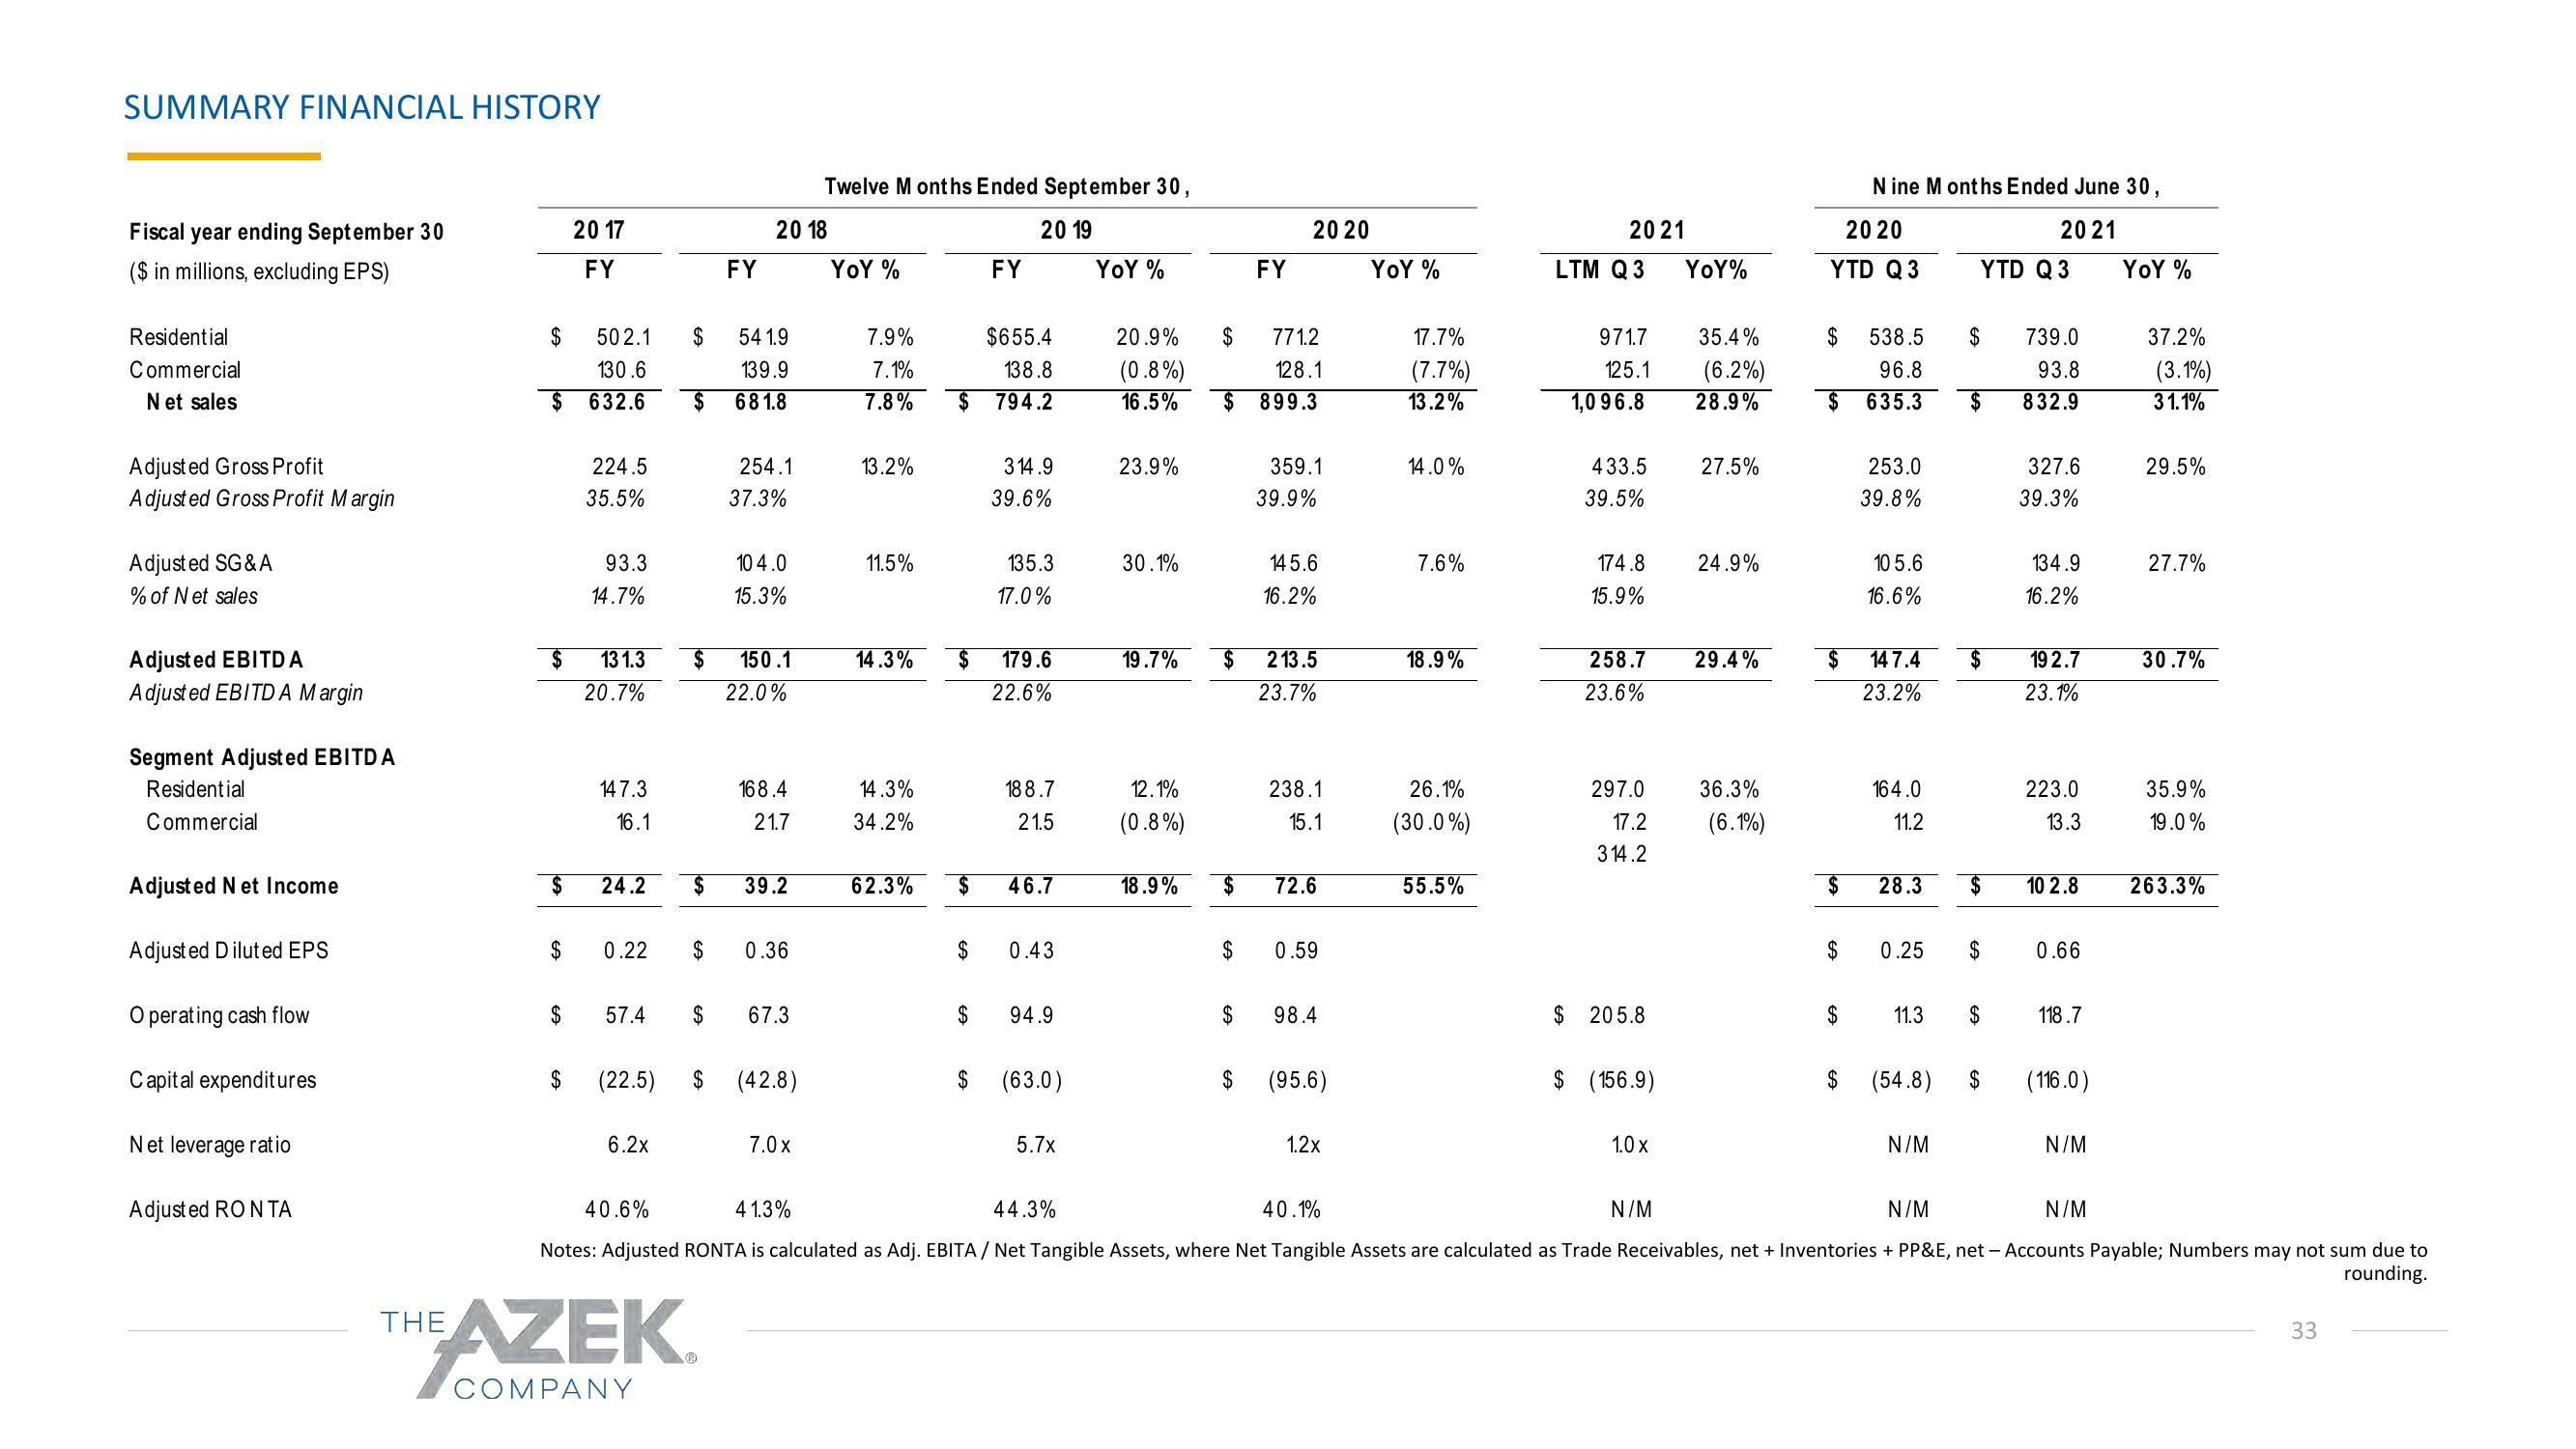
SUMMARY FINANCIAL HISTORY
Fiscal year ending September 30
($ in millions, excluding EPS)
Residential
Commercial
N et sales
Adjusted Gross Profit
Adjusted Gross Profit Margin
Adjusted SG & A
% of Net sales
Adjusted EBITDA
Adjusted EBITDA Margin
Segment Adjusted EBITDA
Residential
Commercial
Adjusted Net Income
Adjusted Diluted EPS
Operating cash flow
Capital expenditures
Net leverage ratio
Adjusted RON TA
$
$
20 17
FY
502.1
130.6
632.6
224.5
35.5%
93.3
14.7%
13 1.3
20.7%
147.3
16.1
$ 24.2 $
$ 0.22 $
$ (22.5)
$
$ 57.4 $
6.2x
$
54 1.9
139.9
$ 681.8
THE AZEK
COMPANY
FY
$
2018
254.1
37.3%
10 4.0
15.3%
150.1
22.0%
168.4
21.7
39.2
0.36
67.3
(42.8)
Twelve M onths Ended September 30,
20 19
YOY %
7.0 x
YOY %
$655.4
138.8
7.8% $ 794.2
7.9%
7.1%
13.2%
11.5%
14.3%
14.3%
34.2%
$
FY
$
$
314.9
39.6%
135.3
17.0%
179.6
22.6%
62.3% $ 46.7
188.7
21.5
0.43
94.9
$ (63.0)
5.7x
20.9%
(0.8%)
16.5%
23.9%
30.1%
19.7% $
12.1%
(0.8%)
18.9%
$ 771.2
128.1
899.3
$
FY
$
20 20
$
359.1
39.9%
145.6
16.2%
$ 72.6
213.5
23.7%
238.1
15.1
0.59
98.4
(95.6)
1.2x
YOY %
17.7%
(7.7%)
13.2%
14.0%
7.6%
18.9%
26.1%
(30.0%)
55.5%
20 21
LTM Q3
971.7
125.1
1,096.8
433.5
39.5%
174.8
15.9%
258.7
23.6%
297.0
17.2
314.2
$ 205.8
$ (156.9)
1.0 x
YoY%
N/M
35.4%
(6.2%)
28.9%
27.5%
24.9%
29.4%
36.3%
(6.1%)
20 20
YTD Q3
$ 538.5
96.8
635.3
N ine M onths Ended June 30,
20 21
$
$ 147.4
23.2%
$
253.0
39.8%
$
105.6
16.6%
$ 28.3
164.0
11.2
0.25
(54.8)
YTD Q 3
N/M
$
$
$
$
11.3 $
$
$
739.0
93.8
832.9
327.6
39.3%
134.9
16.2%
19 2.7
23.1%
223.0
13.3
10 2.8
0.66
118.7
(116.0)
N/M
YOY %
37.2%
(3.1%)
3 1.1%
29.5%
27.7%
30.7%
35.9%
19.0%
44.3%
40.1%
N/M
N/M
40.6%
4 1.3%
Notes: Adjusted RONTA is calculated as Adj. EBITA / Net Tangible Assets, where Net Tangible Assets are calculated as Trade Receivables, net + Inventories + PP&E, net - Accounts Payable; Numbers may not sum due to
rounding.
263.3%
33View entire presentation