First Citizens BancShares Results Presentation Deck
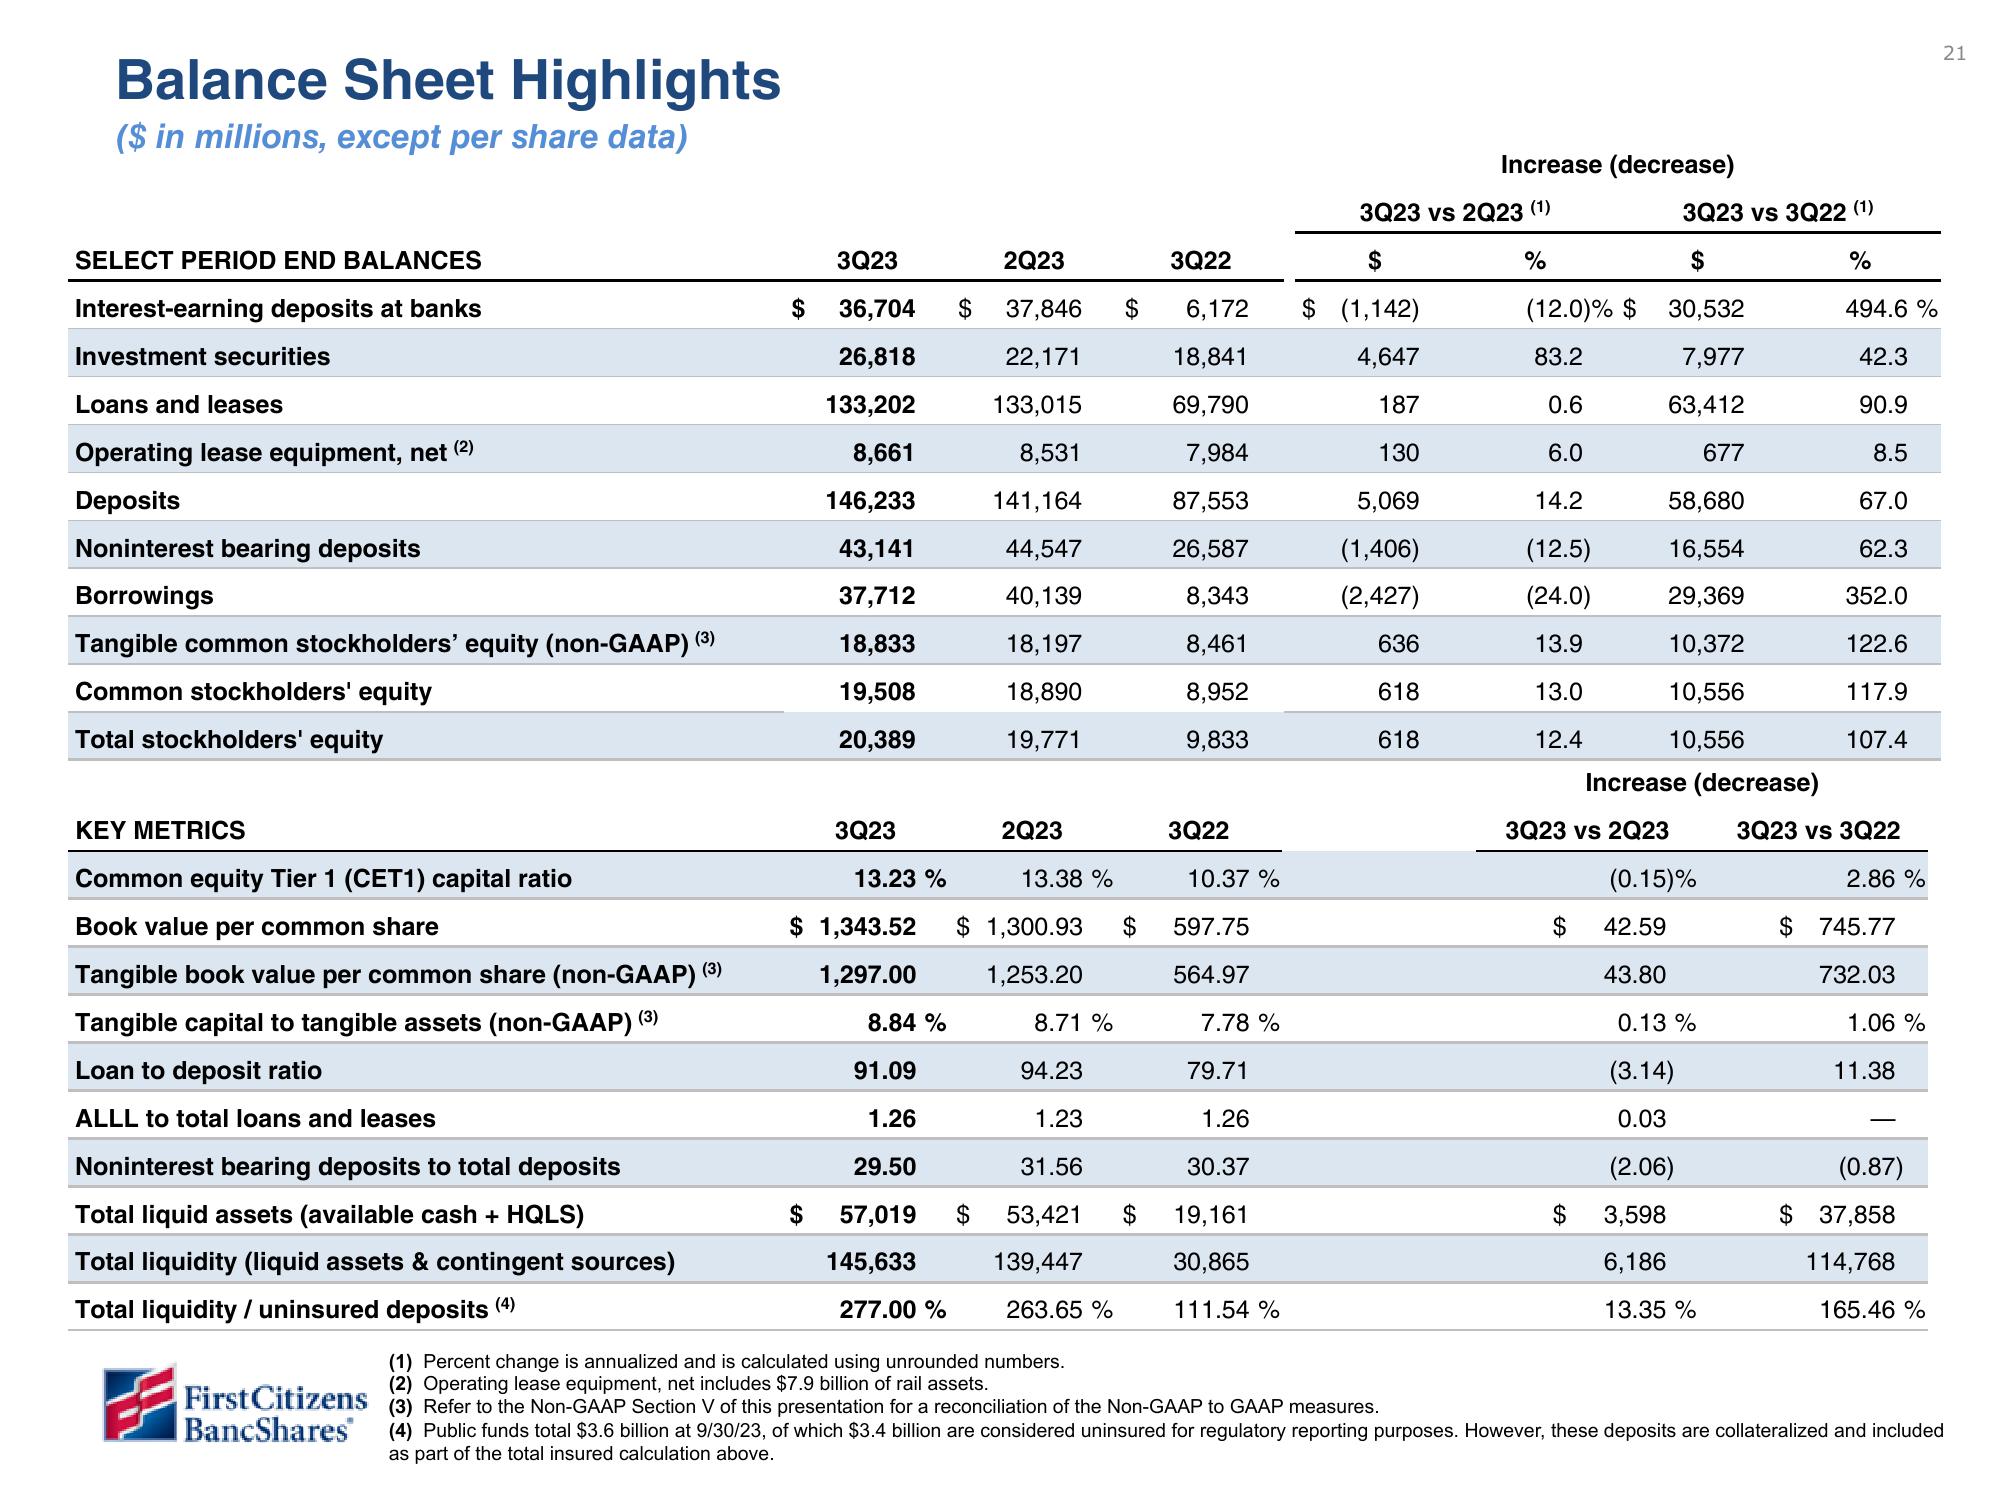
Balance Sheet Highlights
($ in millions, except per share data)
SELECT PERIOD END BALANCES
Interest-earning deposits at banks
Investment securities
Loans and leases
Operating lease equipment, net (2)
Deposits
Noninterest bearing deposits
Borrowings
Tangible common stockholders' equity (non-GAAP) (3)
Common stockholders' equity
Total stockholders' equity
KEY METRICS
Common equity Tier 1 (CET1) capital ratio
Book value per common share
Tangible book value per common share (non-GAAP) (3)
Tangible capital to tangible assets (non-GAAP) (3)
Loan to deposit ratio
ALLL to total loans and leases
Noninterest bearing deposits to total deposits
Total liquid assets (available cash + HQLS)
Total liquidity (liquid assets & contingent sources)
Total liquidity / uninsured deposits (4)
First Citizens
BancShares
$
3Q23
36,704
26,818
133,202
8,661
146,233
43,141
37,712
18,833
19,508
20,389
$
3Q23
13.23%
$ 1,343.52
1,297.00
8.84 %
91.09
1.26
29.50
57,019
145,633
277.00 %
$
2Q23
37,846
22,171
133,015
8,531
141,164
44,547
40,139
18,197
18,890
19,771
$
2Q23
13.38 %
$ 1,300.93 $
1,253.20
8.71%
94.23
1.23
31.56
53,421
139,447
$
263.65 %
$
3Q22
6,172
18,841
69,790
7,984
87,553
26,587
8,343
8,461
8,952
9,833
3Q22
10.37 %
597.75
564.97
7.78%
79.71
1.26
30.37
19,161
30,865
111.54 %
Increase (decrease)
3Q23 vs 2Q23 (1)
$
%
$ (1,142)
4,647
187
130
5,069
(1,406)
(2,427)
636
618
618
(12.0)% $
83.2
0.6
6.0
14.2
(12.5)
(24.0)
13.9
13.0
12.4
$
3Q23 vs 3Q22 (¹)
$
30,532
7,977
63,412
677
58,680
16,554
29,369
10,372
10,556
10,556
3Q23 vs 2Q23
$
Increase (decrease)
(0.15)%
42.59
43.80
0.13%
(3.14)
0.03
(2.06)
3,598
6,186
13.35 %
%
494.6 %
42.3
90.9
8.5
67.0
62.3
352.0
122.6
117.9
107.4
3Q23 vs 3Q22
2.86 %
$ 745.77
732.03
1.06 %
11.38
(0.87)
$ 37,858
114,768
165.46 %
21
(1) Percent change is annualized and is calculated using unrounded numbers.
(2) Operating lease equipment, net includes $7.9 billion of rail assets.
(3) Refer to the Non-GAAP Section V of this presentation for a reconciliation of the Non-GAAP to GAAP measures.
(4) Public funds total $3.6 billion at 9/30/23, of which $3.4 billion are considered uninsured for regulatory reporting purposes. However, these deposits are collateralized and included
as part the total insured calculation above.View entire presentation