Pathward Financial Results Presentation Deck
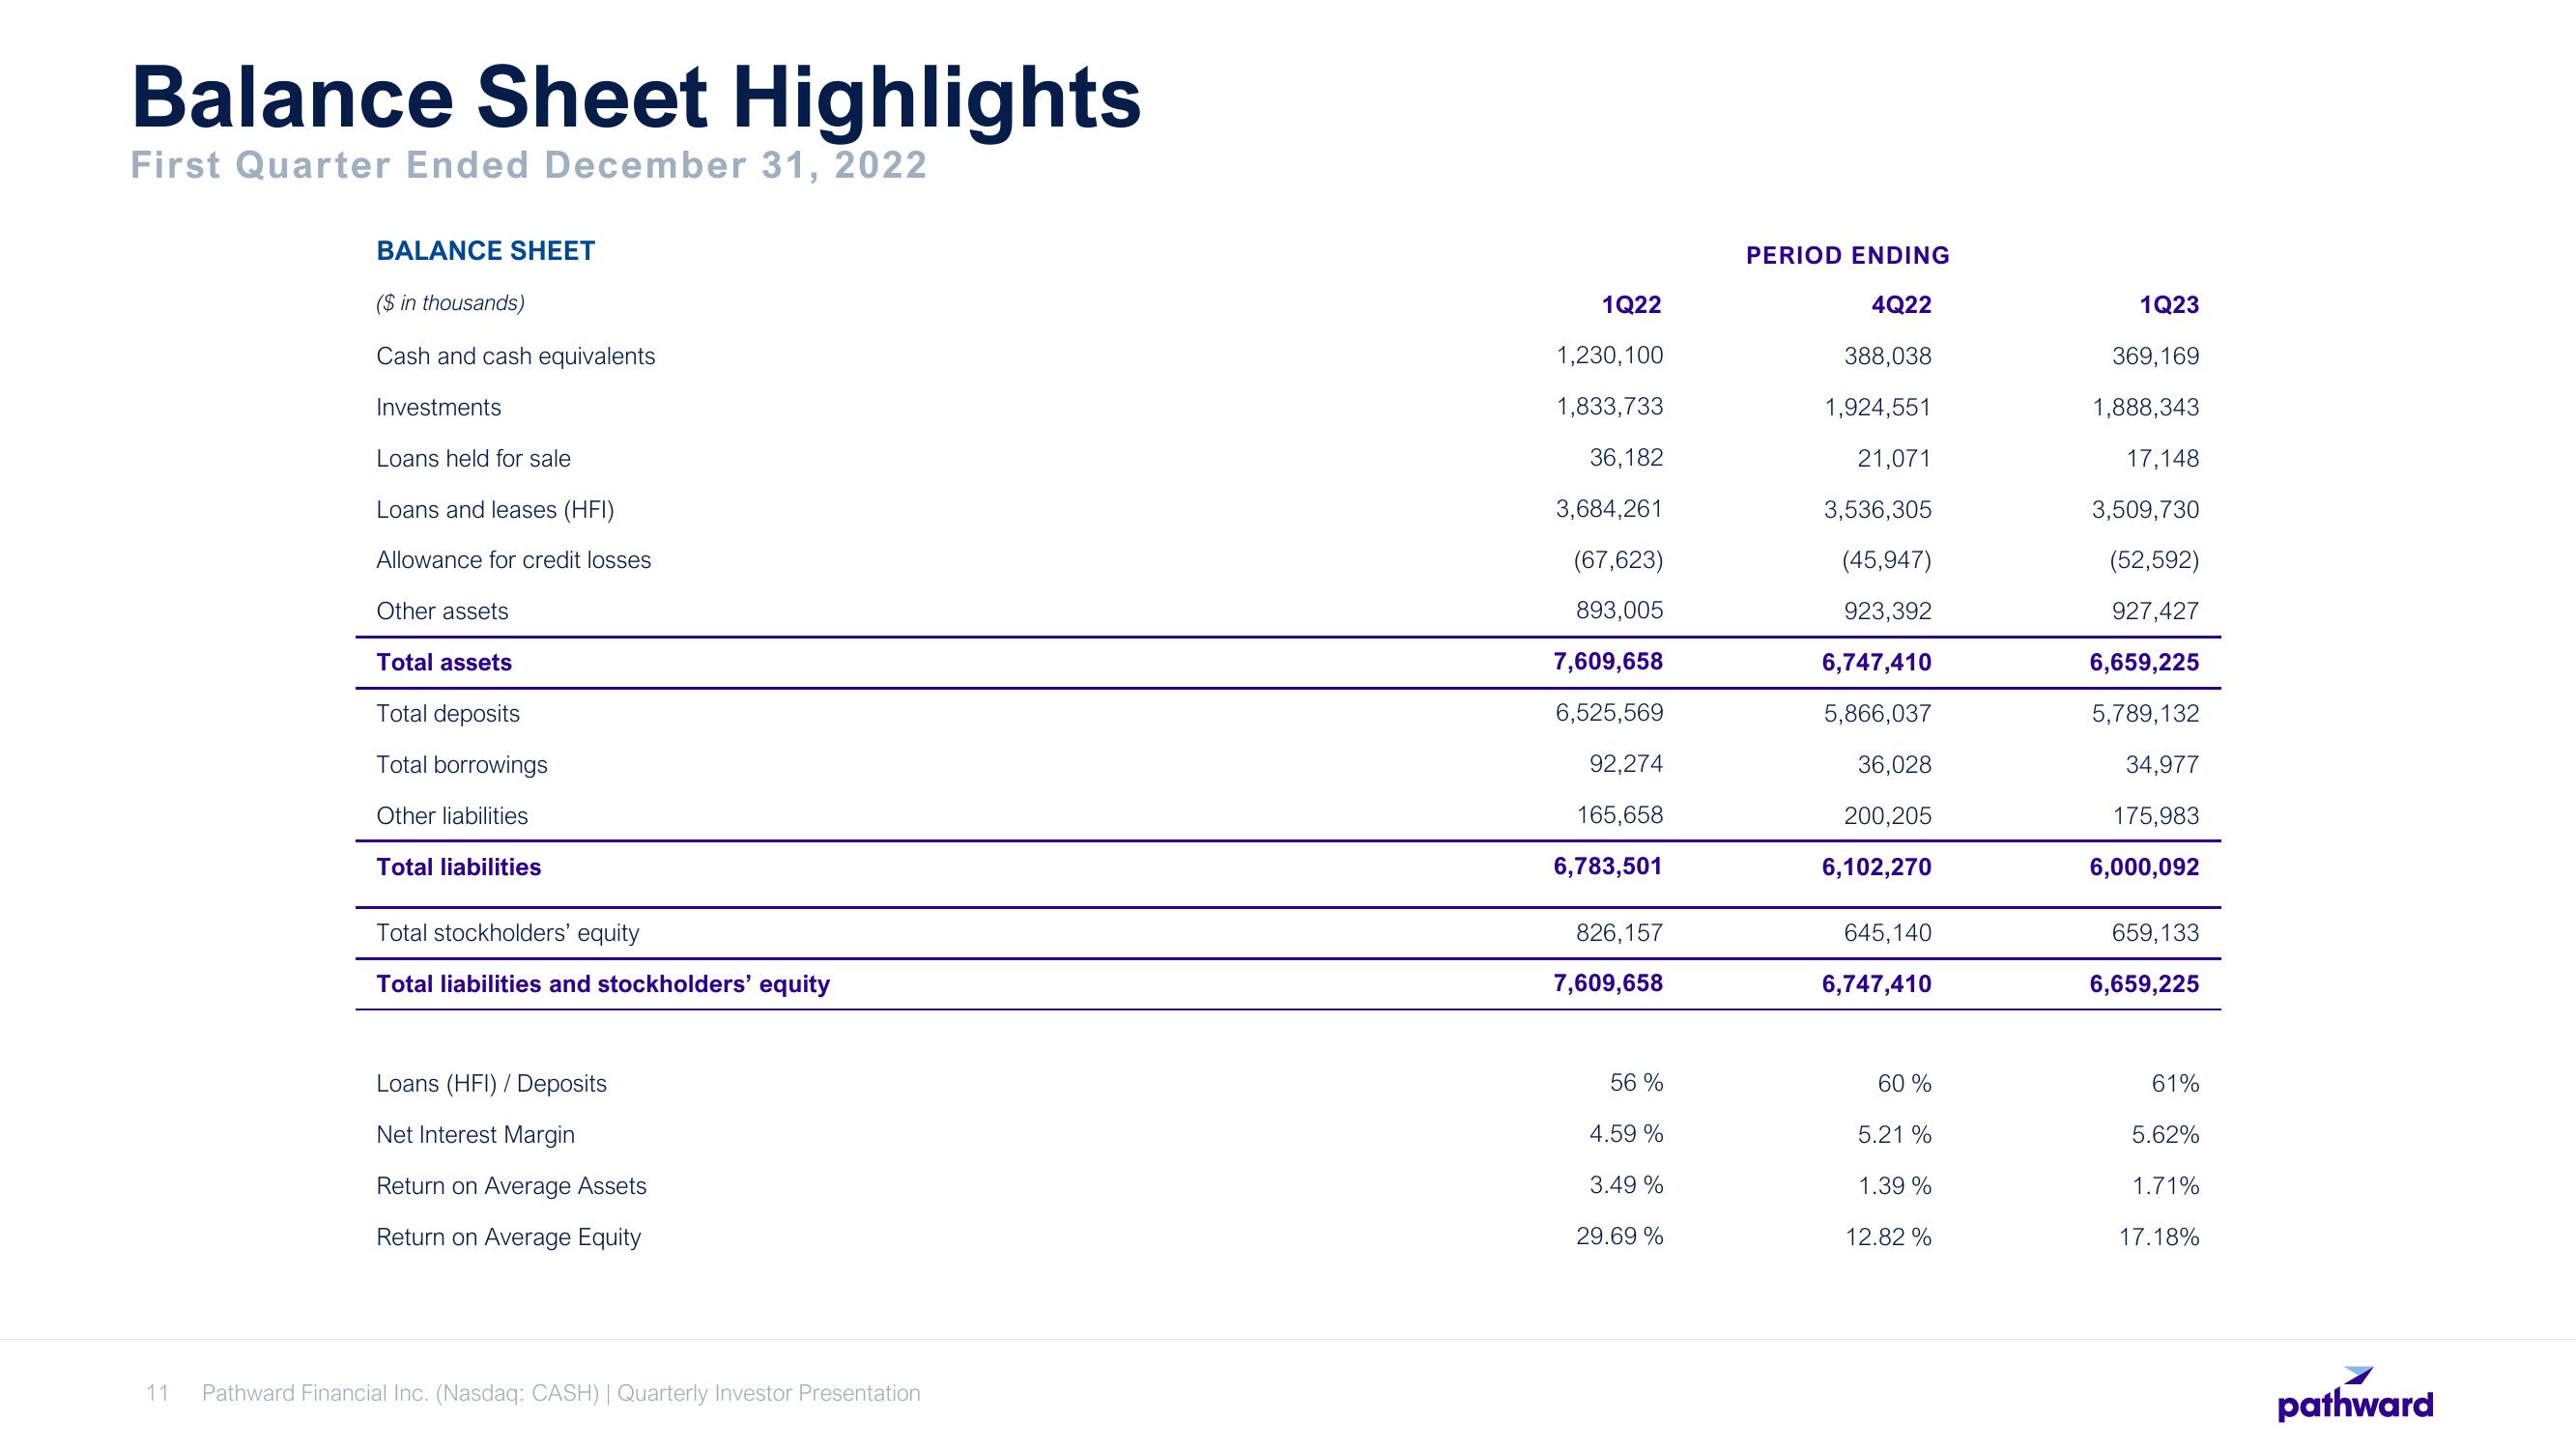
Balance Sheet Highlights
First Quarter Ended December 31, 2022
11
BALANCE SHEET
($ in thousands)
Cash and cash equivalents
Investments
Loans held for sale
Loans and leases (HFI)
Allowance for credit losses
Other assets
Total assets
Total deposits
Total borrowings
Other liabilities
Total liabilities
Total stockholders' equity
Total liabilities and stockholders' equity
Loans (HFI) / Deposits
Net Interest Margin
Return on Average Assets
Return on Average Equity
Pathward Financial Inc. (Nasdaq: CASH) | Quarterly Investor Presentation
1Q22
1,230,100
1,833,733
36,182
3,684,261
(67,623)
893,005
7,609,658
6,525,569
92,274
165,658
6,783,501
826,157
7,609,658
56 %
4.59%
3.49 %
29.69 %
PERIOD ENDING
4Q22
388,038
1,924,551
21,071
3,536,305
(45,947)
923,392
6,747,410
5,866,037
36,028
200,205
6,102,270
645,140
6,747,410
60%
5.21 %
1.39%
12.82 %
1Q23
369,169
1,888,343
17,148
3,509,730
(52,592)
927,427
6,659,225
5,789,132
34,977
175,983
6,000,092
659,133
6,659,225
61%
5.62%
1.71%
17.18%
pathwardView entire presentation