Active and Passive Investing
Have Active Managers Outperformed in the Long Run?
Apparent positive empirical performance of active managers as a group
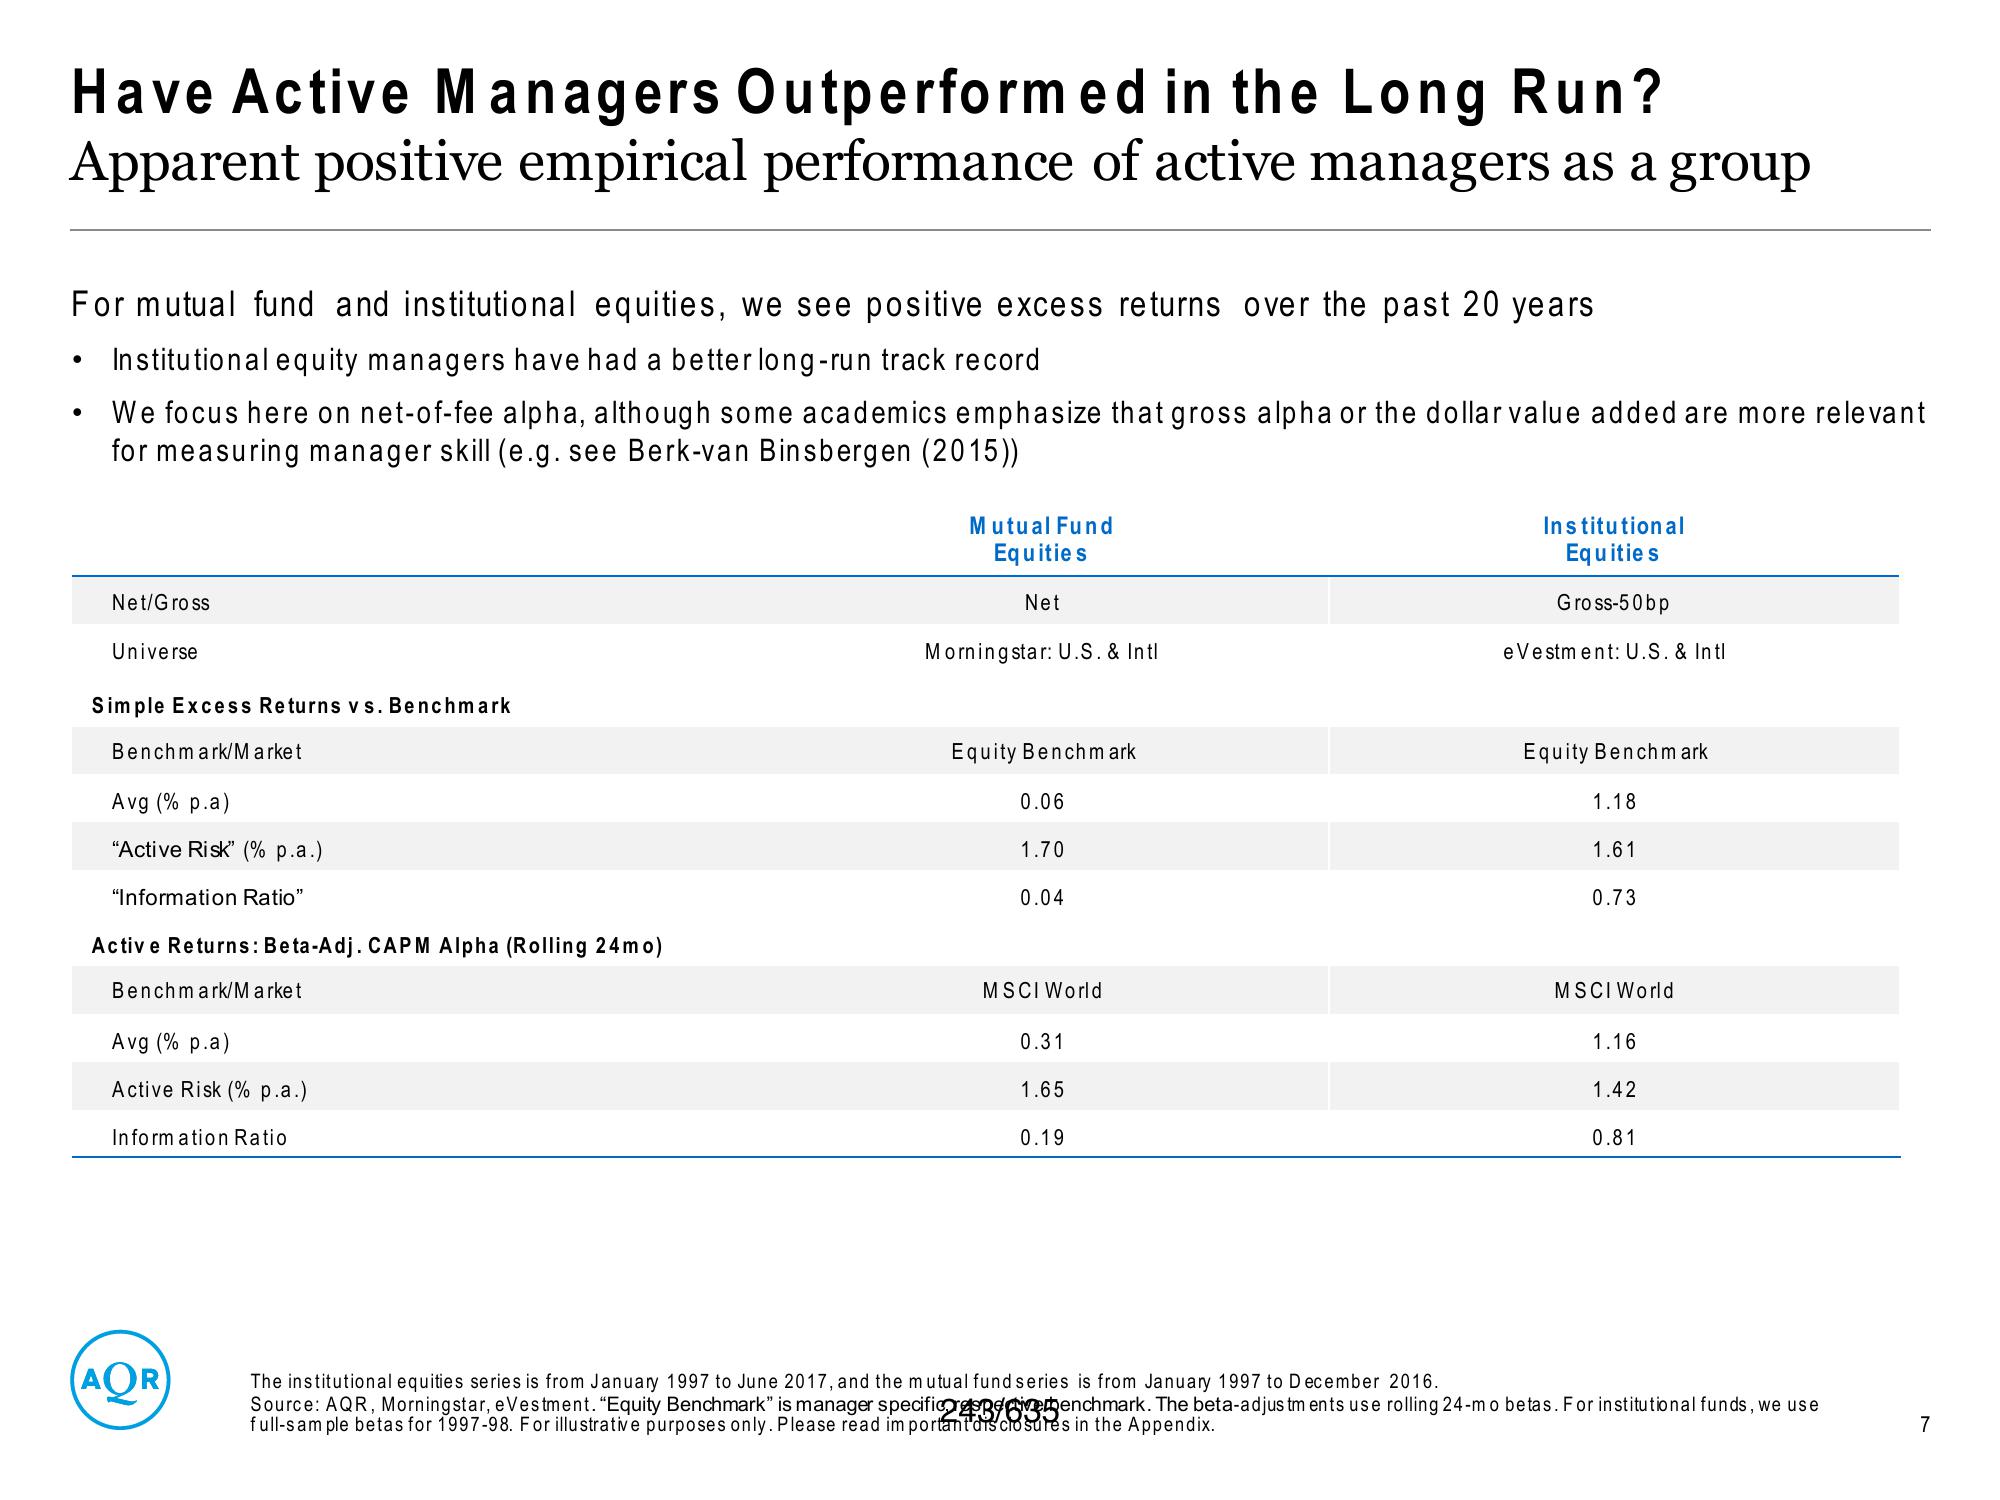
For mutual fund and institutional equities, we see positive excess returns over the past 20 years
Institutional equity managers have had a better long-run track record
We focus here on net-of-fee alpha, although some academics emphasize that gross alpha or the dollar value added are more relevant
for measuring manager skill (e.g. see Berk-van Binsbergen (2015))
●
Net/Gross
Universe
Simple Excess Returns vs. Benchmark
Benchmark/Market
Avg (% p.a)
"Active Risk" (% p.a.)
"Information Ratio"
Active Returns: Beta-Adj. CAPM Alpha (Rolling 24mo)
Benchmark/Market
Avg (% p.a)
Active Risk (% p.a.)
Information Ratio
(AOR
Mutual Fund
Equities
Net
Morningstar: U.S. & Intl
Equity Benchmark
0.06
1.70
0.04
MSCI World
0.31
1.65
0.19
Institutional
Equities
Gross-50bp
e Vestment: U.S. & Intl
Equity Benchmark
1.18
1.61
0.73
MSCI World
1.16
1.42
0.81
The institutional equities series is from January 1997 to June 2017, and the mutual fund series is from January 1997 to December 2016.
Source: AQR, Morningstar, eVestment. "Equity Benchmark" is manager specific speeenchmark. The beta-adjustments use rolling 24-mo betas. For institutional funds, we use
full-sample betas for 1997-98. For illustrative purposes only. Please read important disclosures in the Appendix.
7View entire presentation