Polestar Investor Presentation Deck
1
New entrants represent an
incentive for further EV charging
infrastructure build-out
T
917
TESLA
721
SONO MOTORS
663
588
4 Decreasing TCO and improving
technology
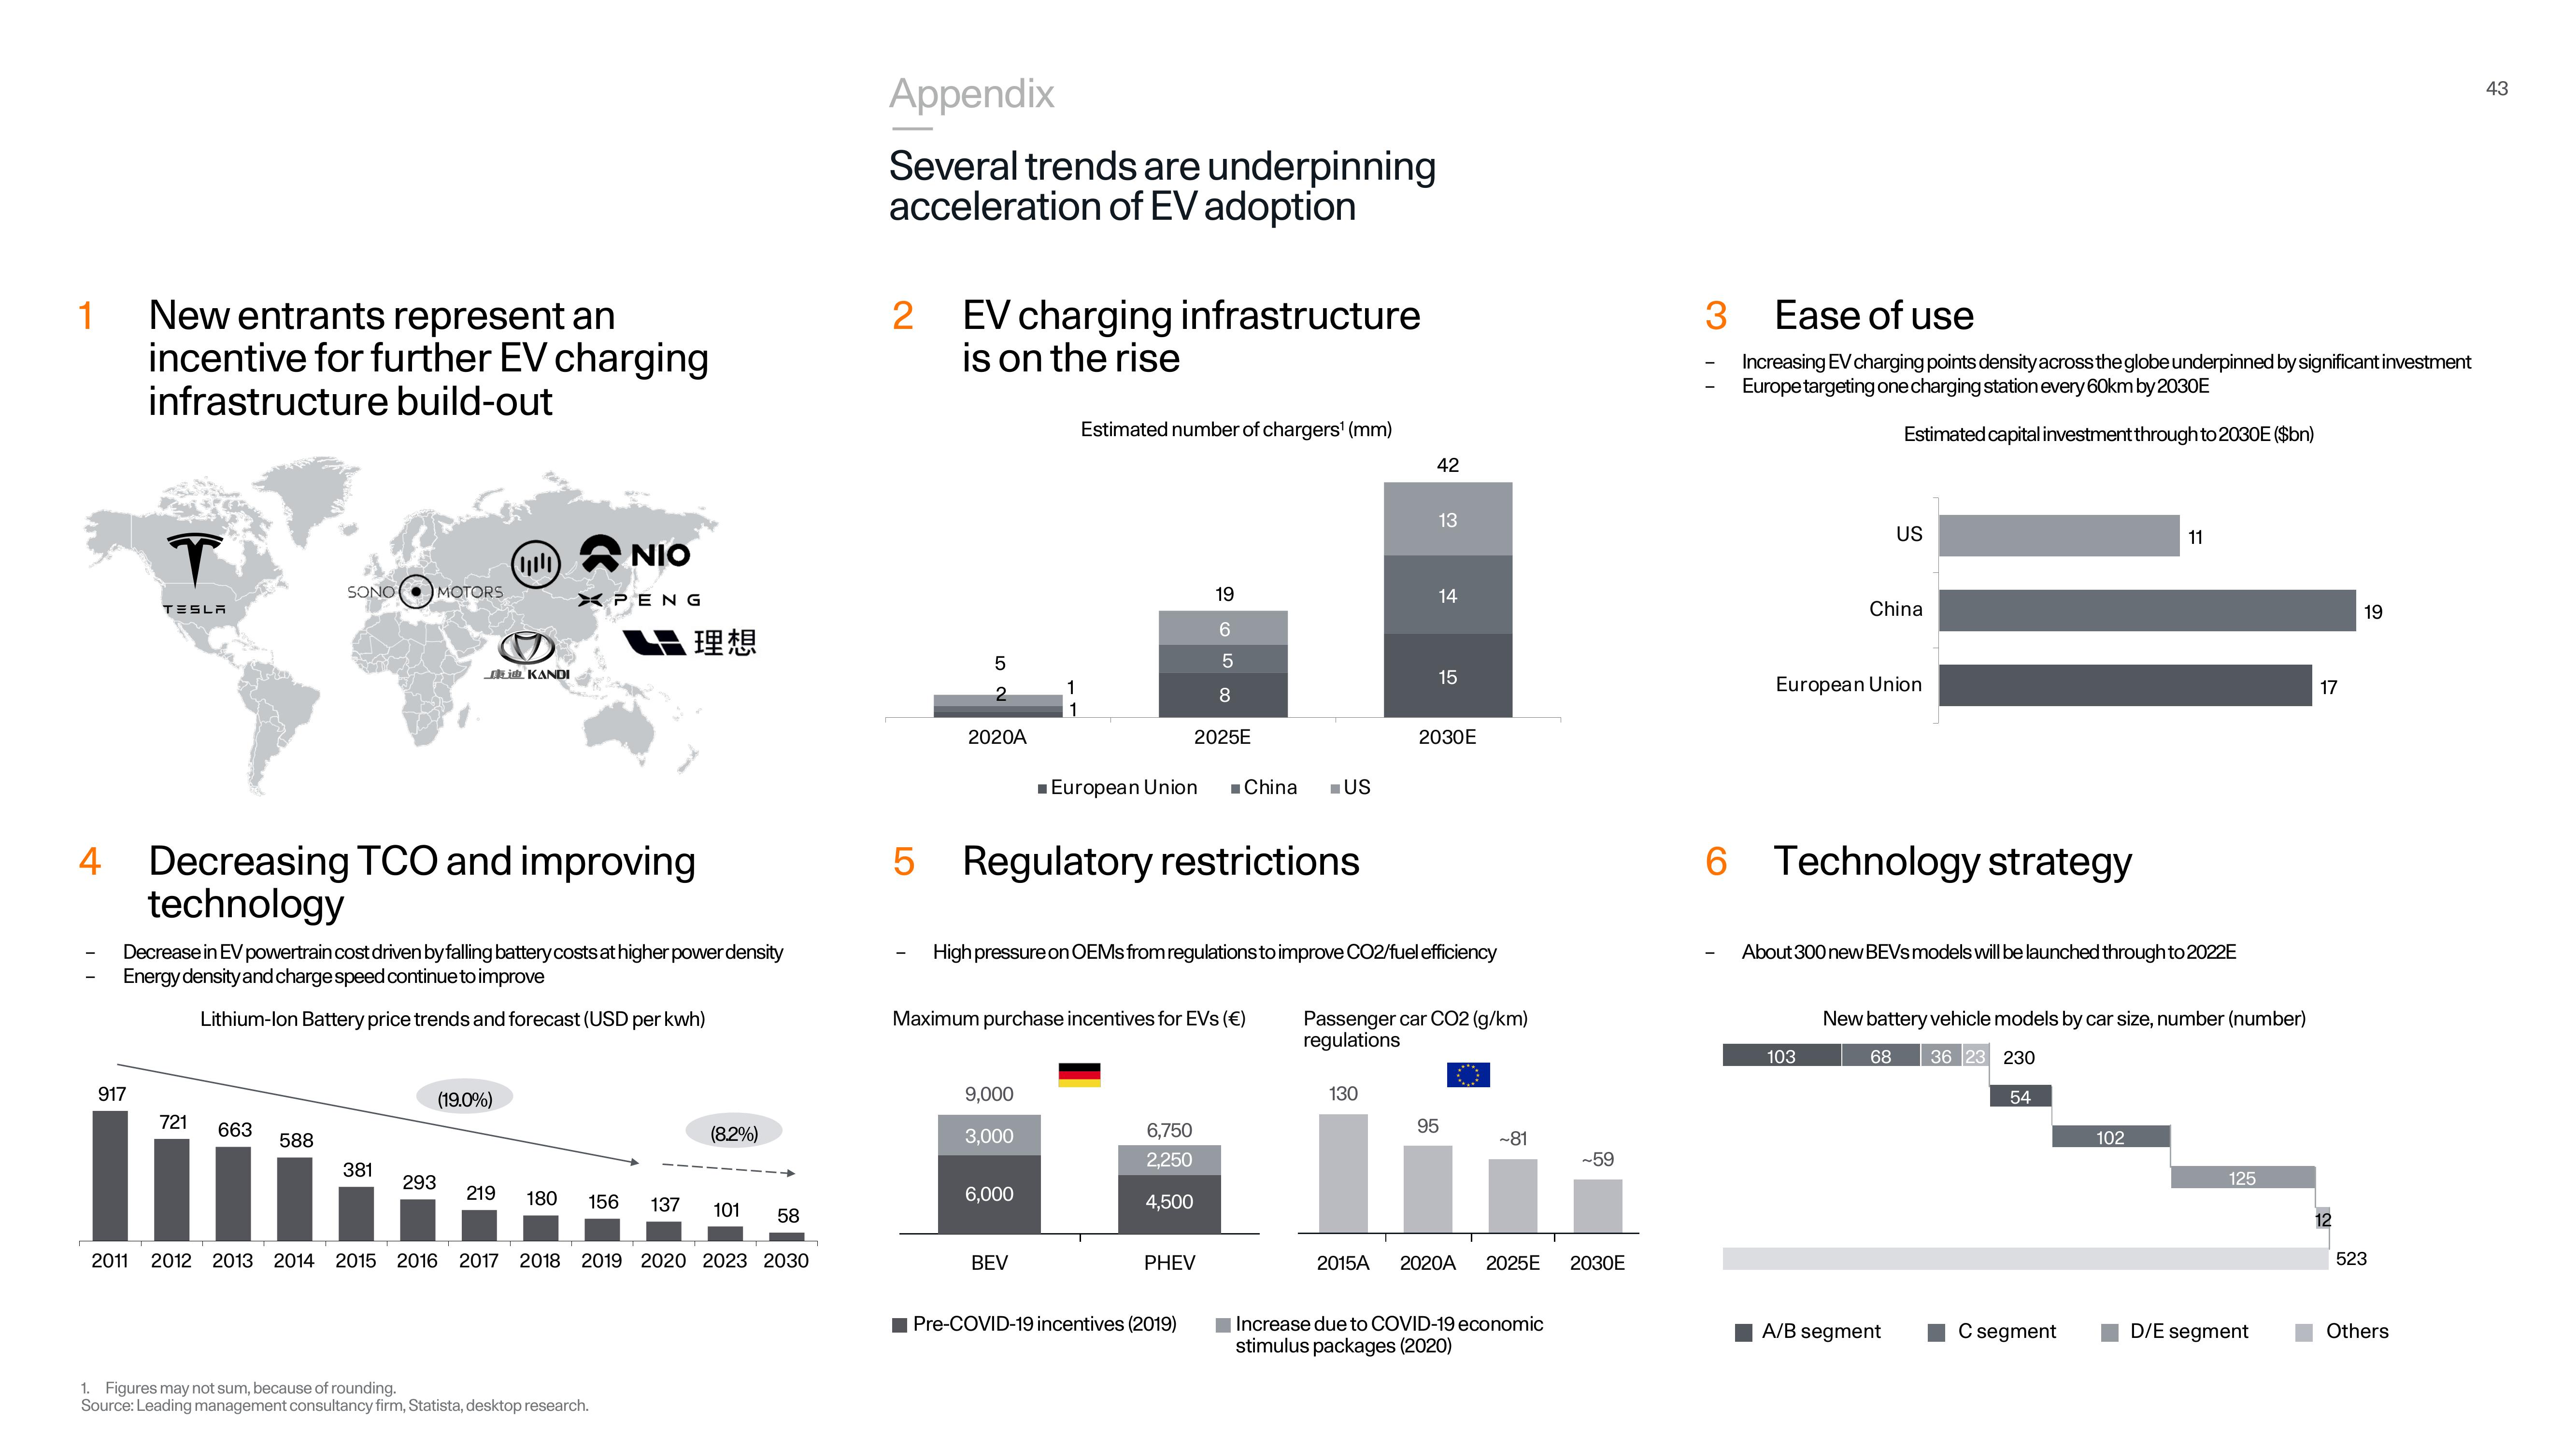
Decrease in EV powertrain cost driven by falling battery costs at higher power density
Energy density and charge speed continue to improve
Lithium-Ion Battery price trends and forecast (USD per kwh)
381
(414)
(19.0%)
KANDI
293
XPENG
NIO
219 180 156
理想
1. Figures may not sum, because of rounding.
Source: Leading management consultancy firm, Statista, desktop research.
(8.2%)
137 101
58
2011 2012 2013 2014 2015 2016 2017 2018 2019 2020 2023 2030
Appendix
Several trends are underpinning
acceleration of EV adoption
2 EV charging infrastructure
is on the rise
5
2020A
Estimated number of chargers¹ (mm)
5 Regulatory restrictions
9,000
3,000
6,000
19
6
5
8
2025E
■ European Union Chinal ■US
Maximum purchase incentives for EVs (€)
BEV
High pressure on OEMs from regulations to improve CO2/fuel efficiency
6,750
2,250
4,500
PHEV
Pre-COVID-19 incentives (2019)
42
13
130
15
2030E
Passenger car CO2 (g/km)
regulations
95
~81
2015A 2020A 2025E
Increase due to COVID-19 economic
stimulus packages (2020)
-59
2030E
3
Ease of use
Increasing EV charging points density across the globe underpinned by significant investment
Europe targeting one charging station every 60km by 2030E
Estimated capital investment through to 2030E ($bn)
US
China
European Union
Technology strategy
103
About 300 new BEVS models will be launched through to 2022E
A/B segment
New battery vehicle models by car size, number (number)
68
36 23 230
54
11
C segment
102
125
D/E segment
17
12
19
523
Others
43View entire presentation